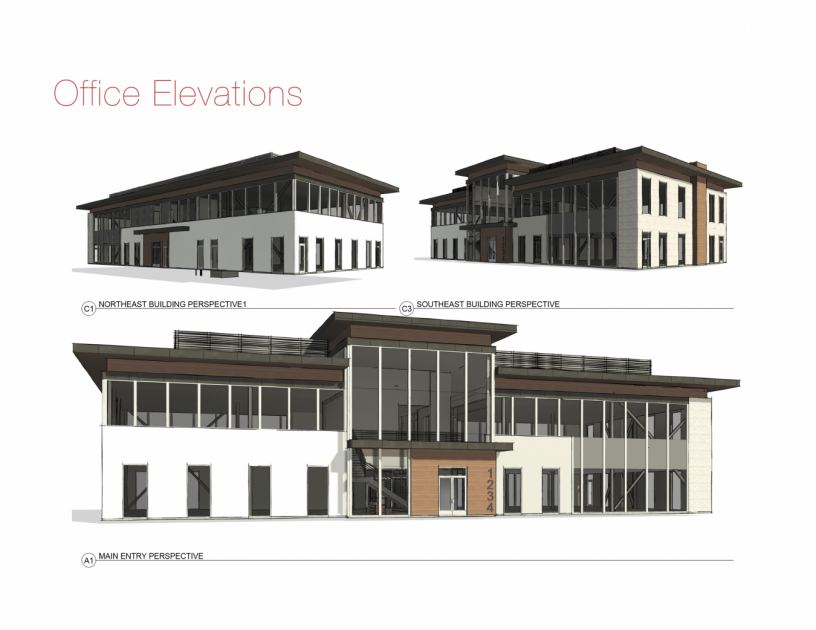
Retail Space
1554 West Pleasant Grove Boulevard Pleasant Grove, UT 84062
1554 West Pleasant Grove Boulevard Pleasant Grove, UT 84062
Details & Description
Property Highlights
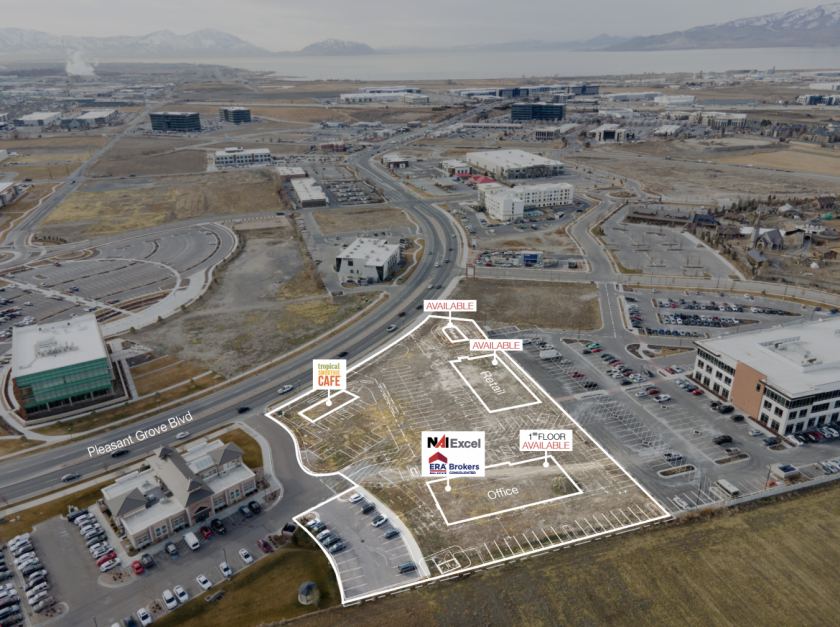
- • Office, Retail Restaurant Space coming soon
- • Located across from DoTerra Campus
- • Spaces already pre-leased
- • Construction in 2023
- • Owner Agent
Listing Agents

Stan Perkins
O: 801-341-0900
M: 435-632-2834
sperkins@naiexcel.com
O: 801-341-0900
M: 435-632-2834
sperkins@naiexcel.com
While we strive to provide the most accurate information, all listing information, and demographic data, is provided by third-parties. As such, MyEListing will not be responsible for the accuracy of the information. It is strongly recommended that you verify all information with the listing agent, and any relevant agencies, prior to making any decisions.