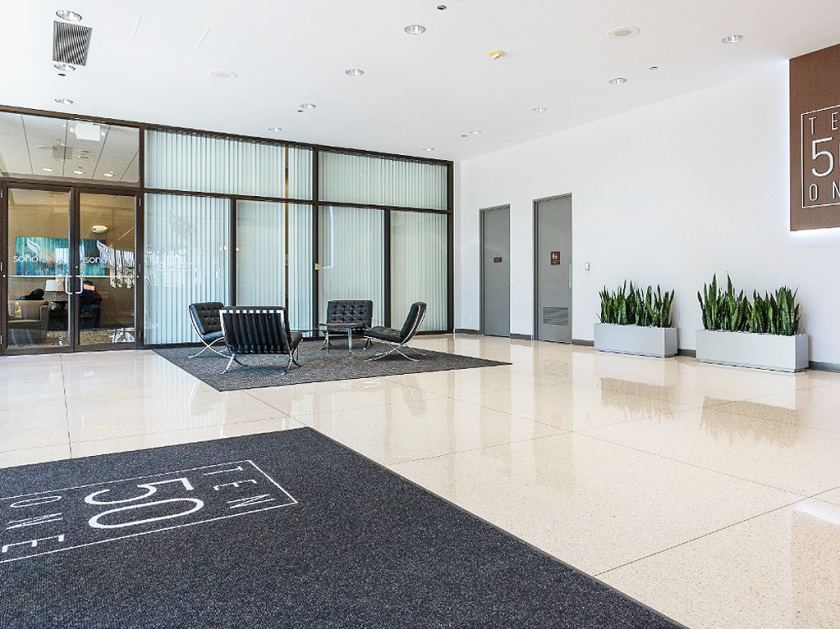
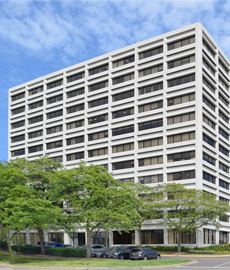
1-Mile | 3-Miles | 5-Miles | ||
---|---|---|---|---|
Total Population | 3,986 | 78,583 | 269,606 | |
Population Median Age | 37 | 40 | 40 | |
Population by Age | 0-9 Yrs | 535 (13%) | 9296 (11%) | 32693 (12%) |
10-19 Yrs | 306 (7%) | 8378 (10%) | 30296 (11%) | |
20-29 Yrs | 707 (17%) | 9609 (12%) | 29979 (11%) | |
30-39 Yrs | 927 (23%) | 12591 (16%) | 38008 (14%) | |
40-49 Yrs | 361 (9%) | 10420 (13%) | 37077 (13%) | |
50-59 Yrs | 367 (9%) | 10756 (13%) | 38250 (14%) | |
60-69 Yrs | 317 (7%) | 8960 (11%) | 32632 (12%) | |
70+ Yrs | 466 (11%) | 8573 (10%) | 30673 (11%) | |
Median HH Income | $65,334 | $79,124 | $85,044 | |
Total Household Income | < 24K | 249 (12%) | 3859 (12%) | 11333 (10%) |
25-49K | 459 (23%) | 5154 (16%) | 17251 (16%) | |
50-74K | 456 (23%) | 6175 (19%) | 18019 (17%) | |
75-99K | 297 (15%) | 4740 (14%) | 15198 (14%) | |
100-199K | 320 (16%) | 8790 (27%) | 31871 (30%) | |
200K+ | 144 (7%) | 3222 (10%) | 11748 (11%) | |
Highest Education Level | No Diploma | 142 | 4643 | 14325 |
Diploma or GED | 628 | 10846 | 37586 | |
Some College | 529 | 9859 | 36062 | |
Assoc. Degree | 127 | 4320 | 14244 | |
Bachelors Degree | 1022 | 17003 | 57564 | |
Higher Degree | 408 | 10255 | 33894 | |
Total Housing Units | 2,022 | 34,163 | 111,754 | |
--Owner-Occupied | 818 | 20,275 | 74,552 | |
--Renter-Occupied | 1,106 | 11,665 | 30,868 | |
Owner-Occupied Values | < 100K | 157 | 1344 | 4567 |
100-199K | 344 | 5662 | 13320 | |
200-299K | 109 | 4813 | 20707 | |
300-399K | 79 | 3687 | 18797 | |
400-499K | 49 | 2470 | 8837 | |
500K+ | 80 | 2299 | 8323 | |
Total Working Age Population | 3,294 | 64,058 | 217,421 | |
In Work Force | 2,343 | 44,773 | 150,870 | |
Not In Work Force | 950 | 19,286 | 66,551 | |
Workforce Employed | 2,260 | 43,096 | 145,088 | |
Workforce Unemployed | 84 | 1,605 | 5,619 | |
Civlian Workforce | 2,343 | 44,701 | 150,707 | |
Military Workforce | 0 | 72 | 163 | |
Total Households | 1,924 | 31,939 | 105,420 | |
Family Households | 862 | 19,657 | 70,448 | |
Non-Family Households | 1,062 | 12,283 | 34,972 | |
Married Couple | 671 | 16,015 | 57,990 | |
Other Family | 191 | 3,641 | 12,458 | |
Married w/Child | 347 | 6,961 | 24,716 | |
Single Male w/Child | 25 | 422 | 1,398 | |
Single Female w/Child | 50 | 1,119 | 3,705 |
Population Change Last Two Decades - Plus Projection
2000 | % | 2010 | % | 2020 | % | 2030 | |
---|---|---|---|---|---|---|---|
Illinois | 12,419,293 | +3 | 12,830,632 | +12 | 14,316,487 | +6 | 15,138,849 |
Cook County | 5,376,741 | -3 | 5,194,675 | +10 | 5,707,832 | +5 | 5,990,243 |
DuPage County | 904,161 | +1 | 916,924 | +10 | 1,010,323 | +2 | 1,034,039 |
Total Working Age Population:
Total Households:
Total Working Age Population:
Total Households:
Total Working Age Population:
Total Households: