Retail Space
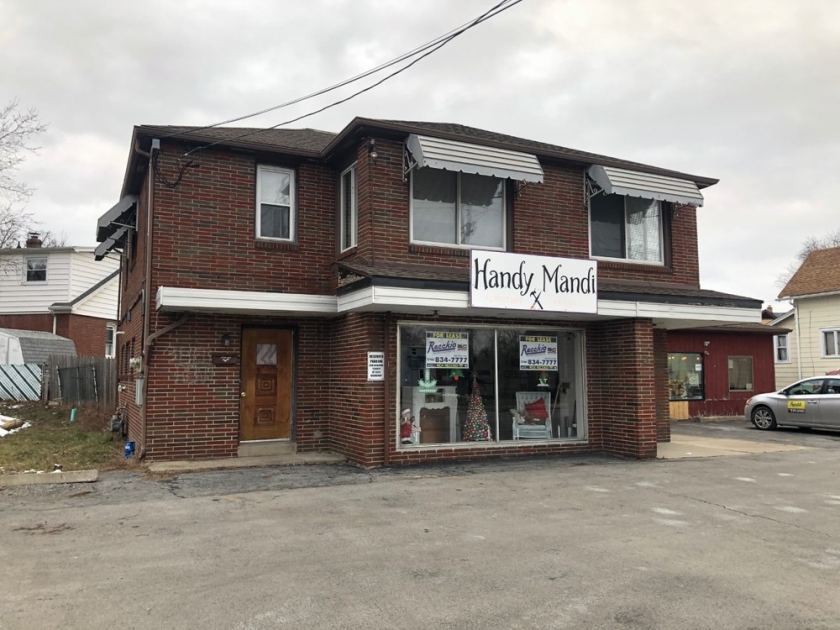
5026 Broadway Depew, NY 14043
5026 Broadway Depew, NY 14043

Details & Description
Property Highlights
- • Excellent Location - High Visibility
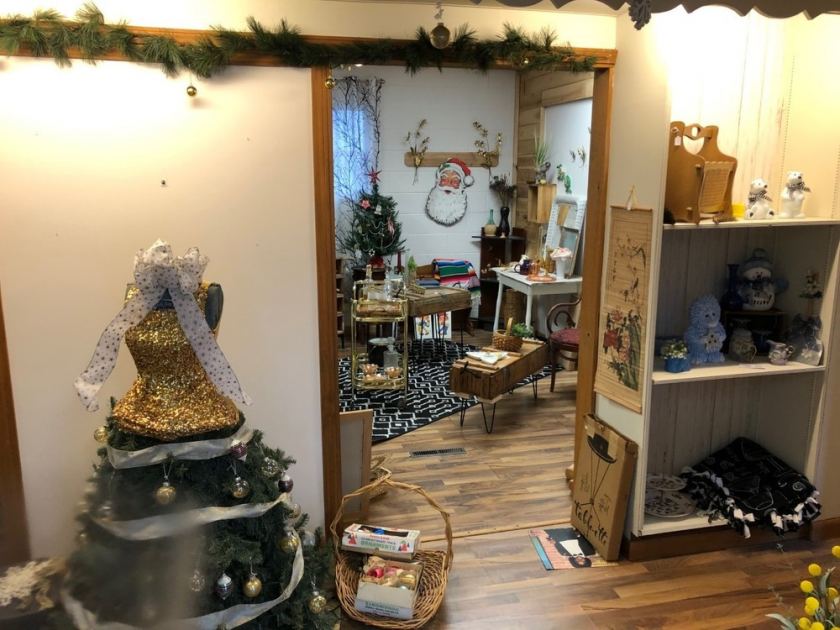
- • 4,390 - SF Retail Space Available
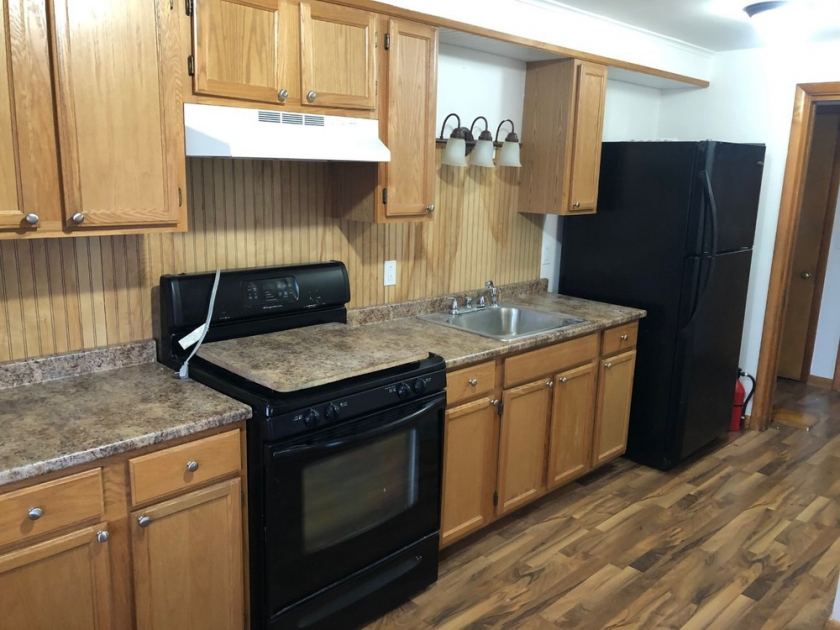
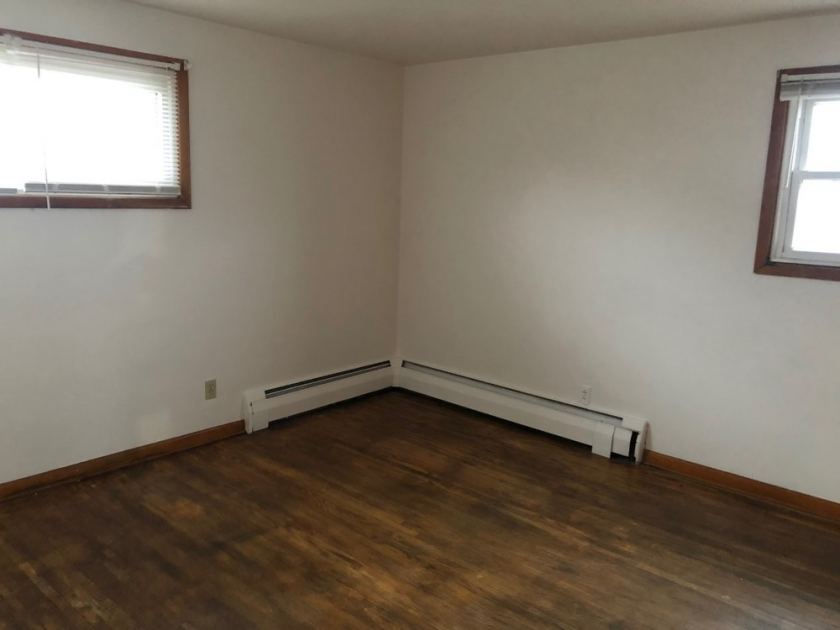
- • 3 Bedroom Apartment Available Upstairs
- • Minutes from New York State Thruway I-90
- • 12 mile from Broadway Transit Road Intersection
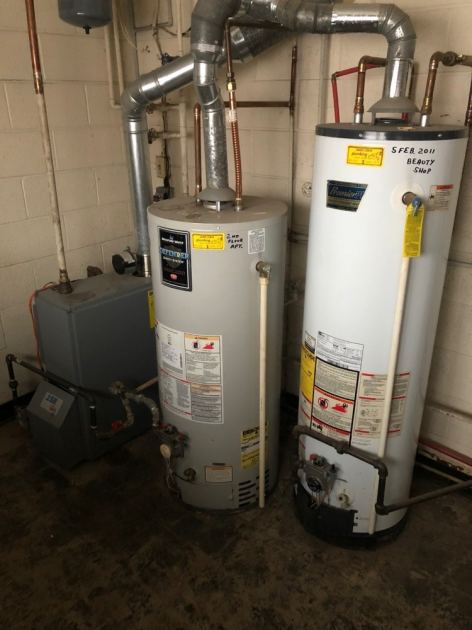
Additional Photos


Listing Agents

Rick Recckio
O: 716-631-5555
M: 716-998-4422
rick@recckio.com
O: 716-631-5555
M: 716-998-4422
rick@recckio.com
While we strive to provide the most accurate information, all listing information, and demographic data, is provided by third-parties. As such, MyEListing will not be responsible for the accuracy of the information. It is strongly recommended that you verify all information with the listing agent, and any relevant agencies, prior to making any decisions.