Property Highlights
±2,500 - ±10,000 SF Available
Full Building or Per Unit Availability
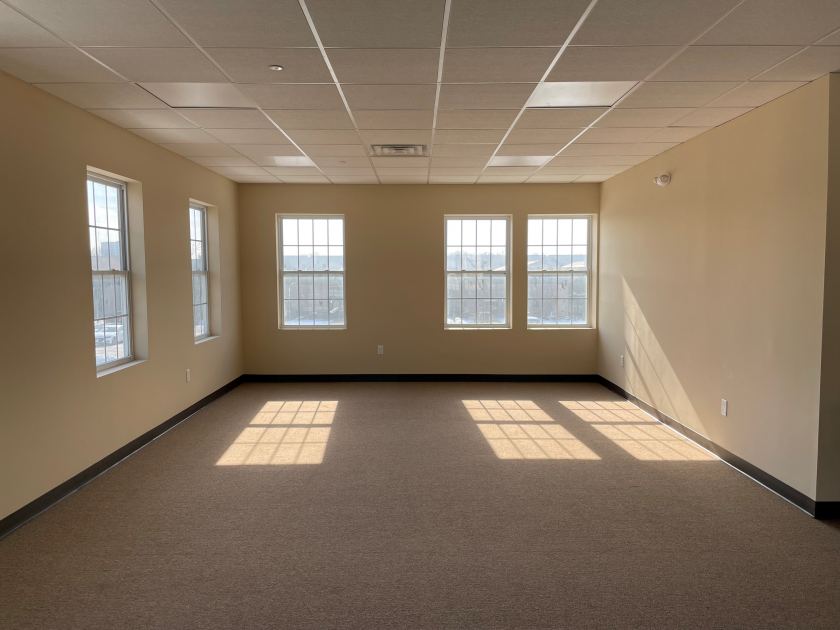
Base Build Condition, Fit-Out to Suit
Elevator Served Building
5:1000 Parking
Office Park Setting
Hospitals Nearby Include Piscataway Pediatrics, St. Peters University Hospital, Rutgers University Behavioral Health Care, Robert Wood Johnson University Hospital
Renovations Underway
Location
Approx. 0.3 Miles to I-287 | Approx. 8.5 Miles to I-95
Approx. 10.6 Miles to Garden State Parkway
Approx. 25.5 Miles to Newark Liberty International Airport
Approx. 28.7 Miles to Ports Newark & Elizabeth
No part of this information may be copied, reproduced, repurposed, or screen-captured for any commercial purpose without prior written authorization from MyEListing.
While we strive to provide the most accurate information, all listing information, and demographic data, is provided by third-parties. As such, MyEListing will not be responsible for the accuracy of the information. It is strongly recommended that you verify all information with the listing agent, and any relevant agencies, prior to making any decisions.
What is the asking price for 23 Wills Way in Piscataway?
The asking price for 23 Wills Way is $
What is the building size of this commercial Office property?
The size of this multi-unit property varies between 2500 - 10000 square feet
What kind of Office is the propery at 23 Wills Way?
The property at 23 Wills Way Piscataway, NJ 08854 is listed as a Professional Office property
What is the population within 1 mile of 23 Wills Way in Piscataway?
The population within 1 mile of 23 Wills Way Piscataway, NJ 08854 is 5,881 people.
Who do I contact for questions about 23 Wills Way?
You should contact the listing agent,
Michael Schipper, for any details regarding this commercial listing.