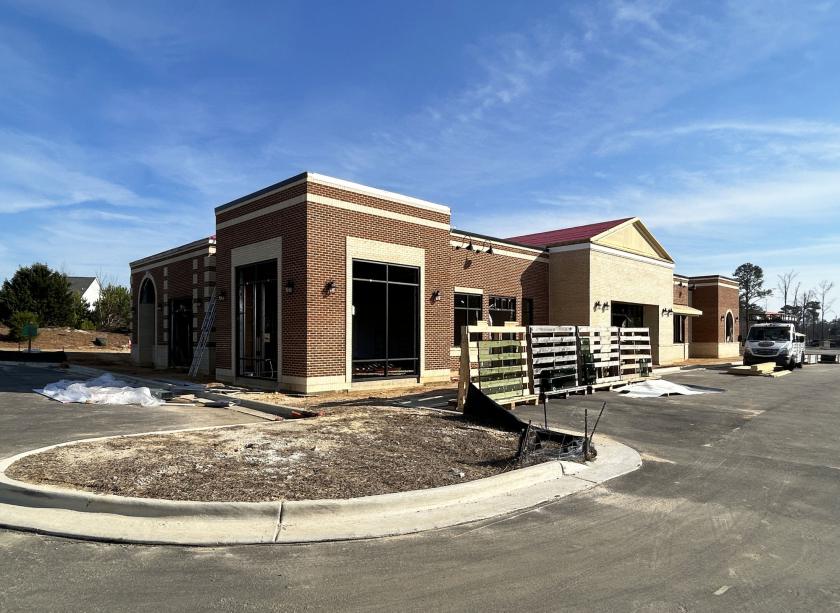
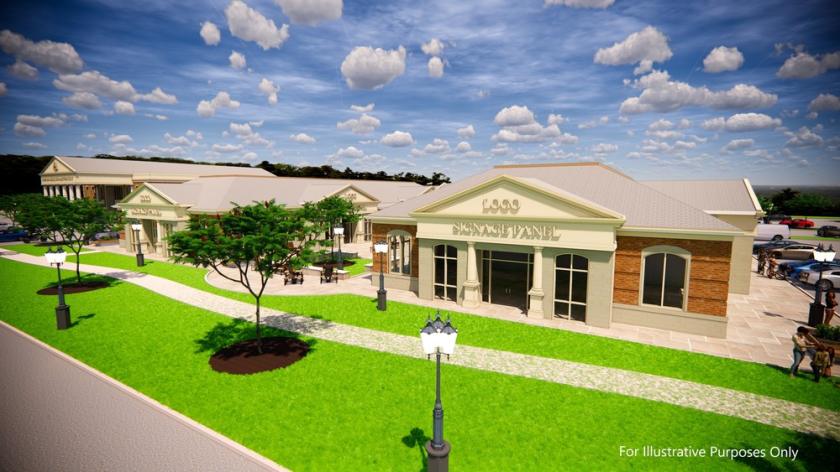
1-Mile | 3-Miles | 5-Miles | ||
---|---|---|---|---|
Total Population | 3,753 | 33,780 | 77,956 | |
Population Median Age | 36 | 36 | 36 | |
Population by Age | 0-9 Yrs | 670 (17%) | 5324 (15%) | 12026 (15%) |
10-19 Yrs | 444 (11%) | 4813 (14%) | 12224 (15%) | |
20-29 Yrs | 387 (10%) | 3378 (10%) | 7007 (8%) | |
30-39 Yrs | 556 (14%) | 4697 (13%) | 11135 (14%) | |
40-49 Yrs | 576 (15%) | 5256 (15%) | 13050 (16%) | |
50-59 Yrs | 457 (12%) | 4536 (13%) | 10727 (13%) | |
60-69 Yrs | 310 (8%) | 2862 (8%) | 6241 (8%) | |
70+ Yrs | 353 (9%) | 2913 (8%) | 5545 (7%) | |
Median HH Income | $84,911 | $84,375 | $94,786 | |
Total Household Income | < 24K | 136 (10%) | 1481 (12%) | 2595 (9%) |
25-49K | 202 (15%) | 1771 (14%) | 3452 (13%) | |
50-74K | 253 (18%) | 2007 (16%) | 3989 (15%) | |
75-99K | 193 (14%) | 1774 (14%) | 3888 (14%) | |
100-199K | 441 (33%) | 3781 (31%) | 9125 (34%) | |
200K+ | 110 (8%) | 1035 (8%) | 3177 (12%) | |
Highest Education Level | No Diploma | 163 | 1288 | 2682 |
Diploma or GED | 483 | 4447 | 8656 | |
Some College | 470 | 4196 | 9276 | |
Assoc. Degree | 271 | 2333 | 5206 | |
Bachelors Degree | 774 | 6739 | 16730 | |
Higher Degree | 311 | 3051 | 7563 | |
Total Housing Units | 1,384 | 12,343 | 27,422 | |
--Owner-Occupied | 1,032 | 8,824 | 20,992 | |
--Renter-Occupied | 303 | 3,024 | 5,235 | |
Owner-Occupied Values | < 100K | 27 | 261 | 681 |
100-199K | 196 | 1779 | 3598 | |
200-299K | 401 | 3214 | 7102 | |
300-399K | 233 | 1930 | 4632 | |
400-499K | 100 | 921 | 2938 | |
500K+ | 75 | 719 | 2041 | |
Total Working Age Population | 2,793 | 25,388 | 57,846 | |
In Work Force | 1,892 | 17,268 | 40,154 | |
Not In Work Force | 901 | 8,120 | 17,692 | |
Workforce Employed | 1,792 | 16,374 | 38,317 | |
Workforce Unemployed | 94 | 844 | 1,721 | |
Civlian Workforce | 1,887 | 17,219 | 40,038 | |
Military Workforce | 5 | 49 | 116 | |
Total Households | 1,335 | 11,848 | 26,227 | |
Family Households | 1,031 | 9,130 | 21,115 | |
Non-Family Households | 304 | 2,717 | 5,112 | |
Married Couple | 882 | 7,737 | 18,125 | |
Other Family | 150 | 1,393 | 2,990 | |
Married w/Child | 445 | 3,937 | 9,862 | |
Single Male w/Child | 35 | 236 | 549 | |
Single Female w/Child | 67 | 681 | 1,387 |
Population Change Last Two Decades - Plus Projection
2000 | % | 2010 | % | 2020 | % | 2030 | |
---|---|---|---|---|---|---|---|
North Carolina | 8,049,313 | +18 | 9,535,483 | +11 | 10,630,691 | +11 | 11,836,070 |
Harnett County | 91,025 | +26 | 114,678 | +20 | 137,358 | +15 | 158,563 |
Wake County | 627,846 | +44 | 900,993 | +23 | 1,109,883 | +20 | 1,328,336 |
Total Working Age Population:
Total Households:
Total Working Age Population:
Total Households:
Total Working Age Population:
Total Households: