Office Space
137 South Main Street Akron, OH 44308
137 South Main Street Akron, OH 44308

Details & Description
Property Highlights
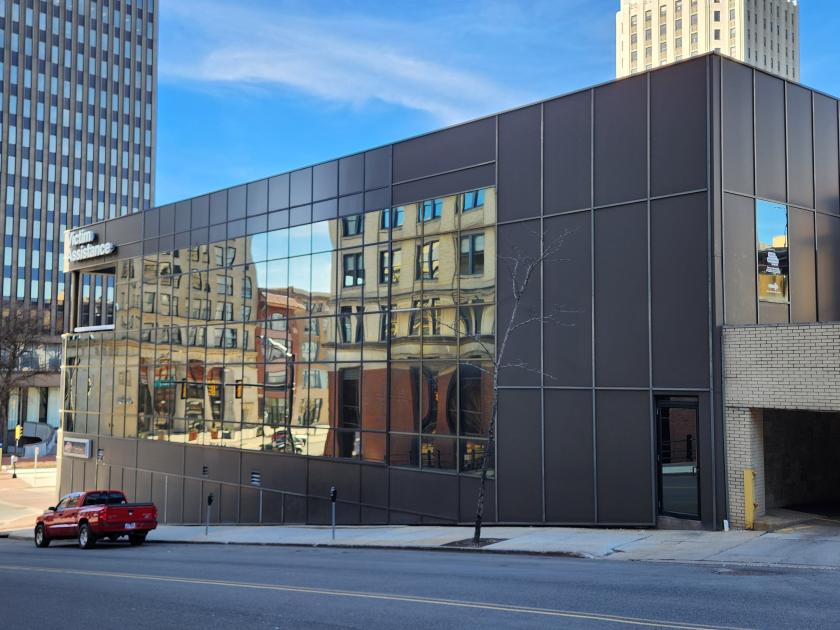
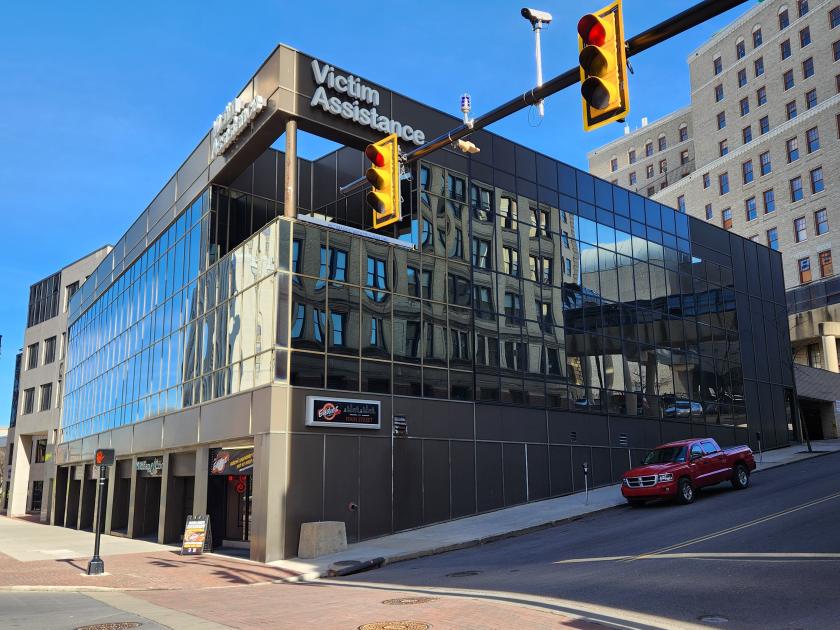
- • Akron CBD Office Building
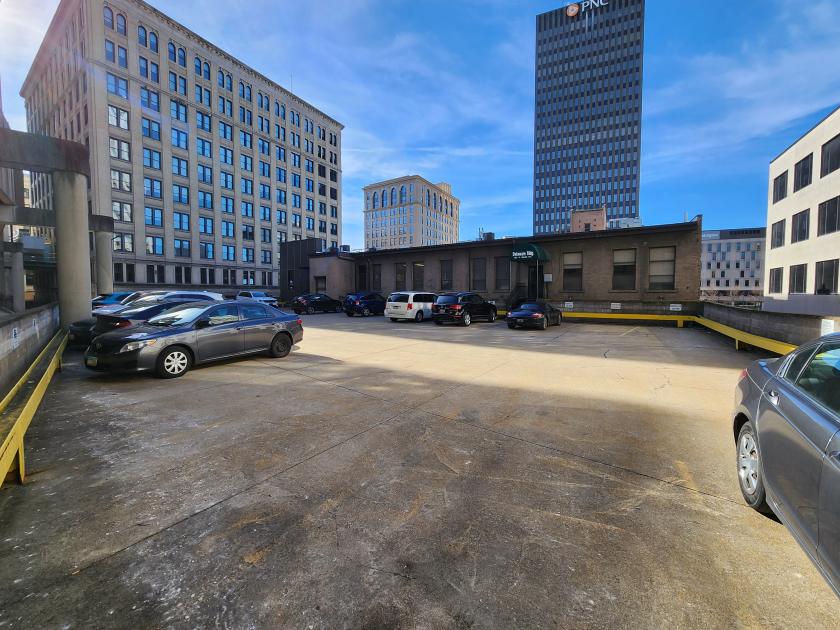
- • Private 44 Car Parking Deck
- • Building Signage Available
- • Skywalk Access
- • Access to Cascade Parking
- • Many New Renovatmions
Additional Photos

Listing Agents

Ron Midcap II
O: 216-455-0900
M: 330-671-7767
rmidcap@naipvc.com
O: 216-455-0900
M: 330-671-7767
rmidcap@naipvc.com
While we strive to provide the most accurate information, all listing information, and demographic data, is provided by third-parties. As such, MyEListing will not be responsible for the accuracy of the information. It is strongly recommended that you verify all information with the listing agent, and any relevant agencies, prior to making any decisions.


