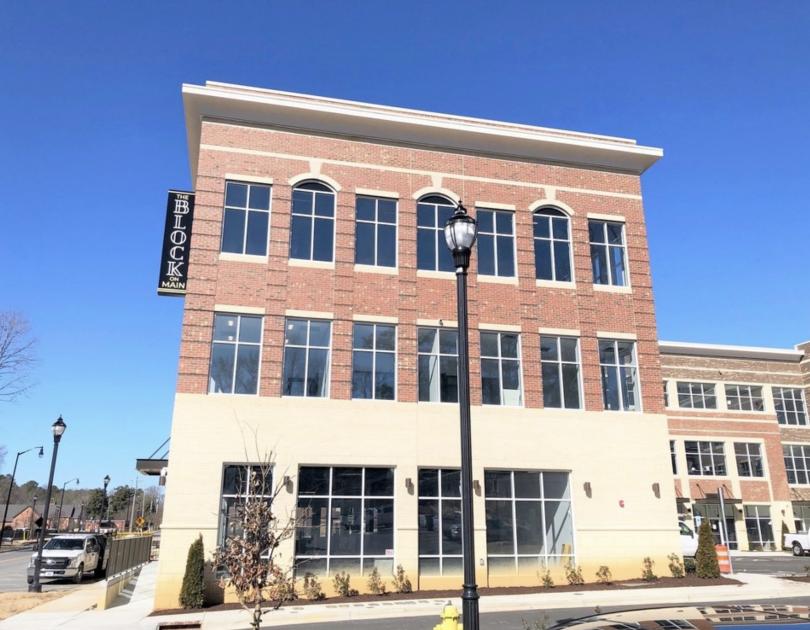
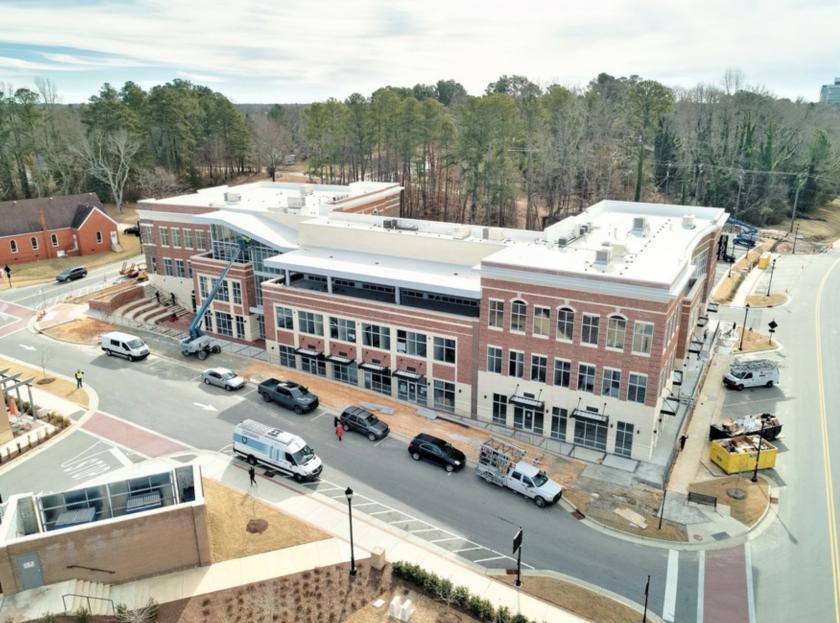
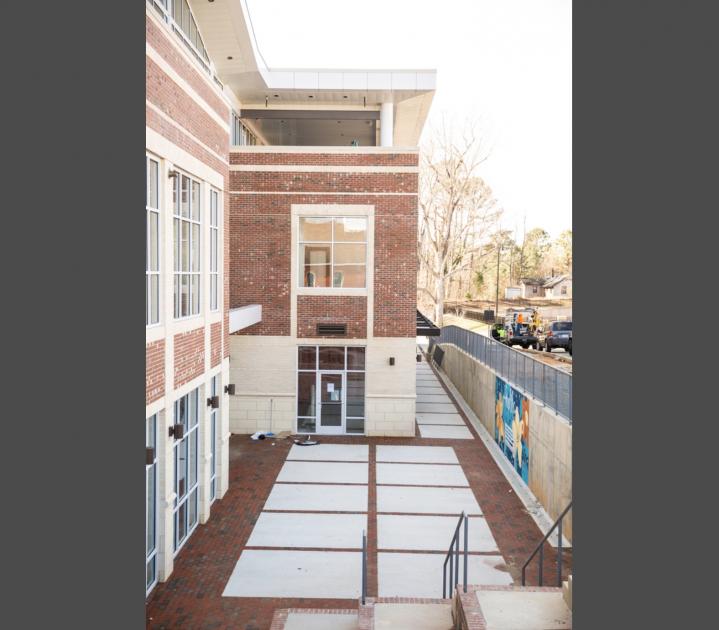
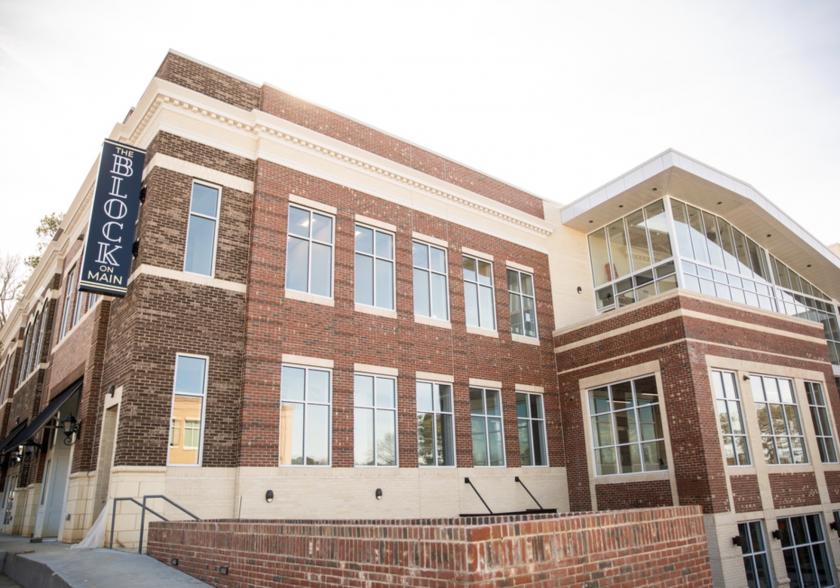
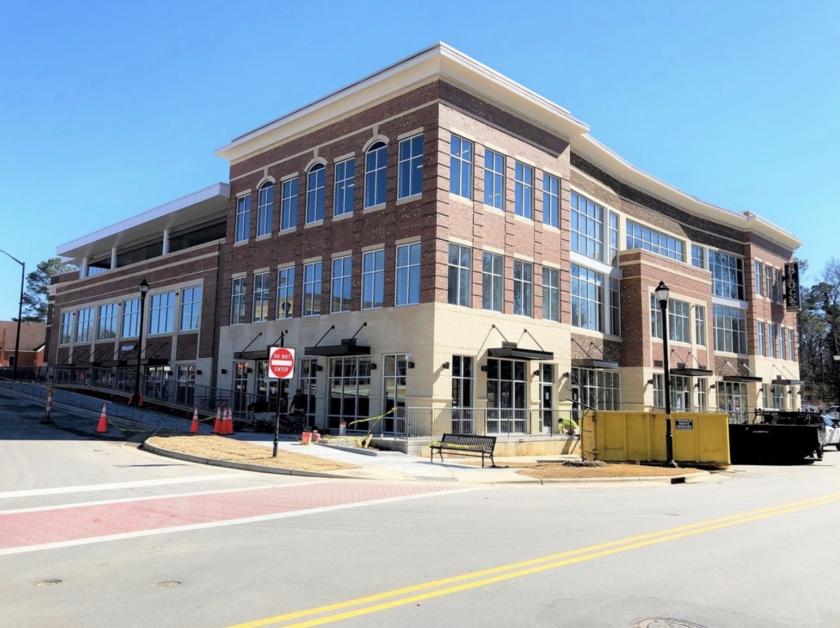
Retail Space
300 South Main Street Holly Springs, NC 27540
300 South Main Street Holly Springs, NC 27540
Details & Description
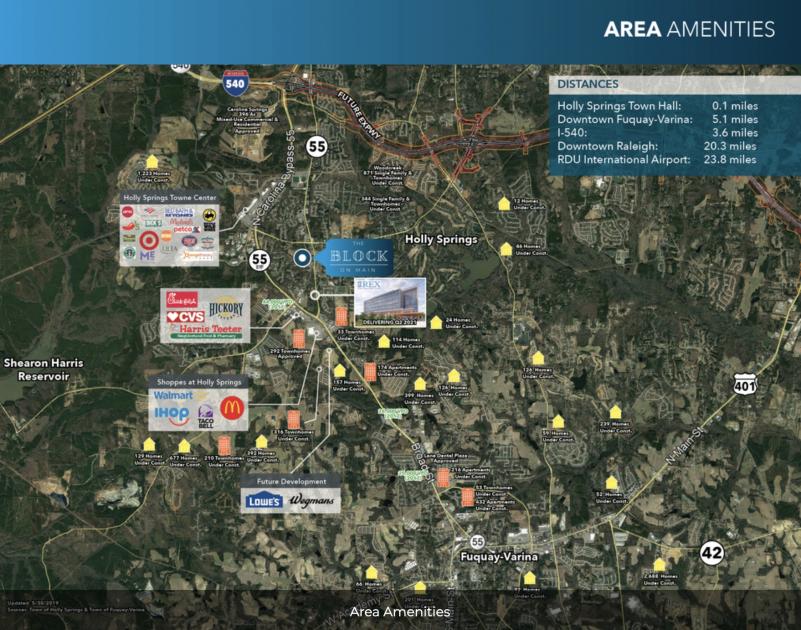
Property Highlights
- • Easy access to Hwy 55 I-540
- • Ideal downtown Holly Springs location
- • Close proximity to amenities
- • Building shell delivered
- • Core factor- 16
- • Traffic count- 15,000 vpd
Additional Photos


Listing Agents

Moss Withers
O: 919-576-2501
M: 919-810-2492
mwithers@lee-associates.com
O: 919-576-2501
M: 919-810-2492
mwithers@lee-associates.com
While we strive to provide the most accurate information, all listing information, and demographic data, is provided by third-parties. As such, MyEListing will not be responsible for the accuracy of the information. It is strongly recommended that you verify all information with the listing agent, and any relevant agencies, prior to making any decisions.