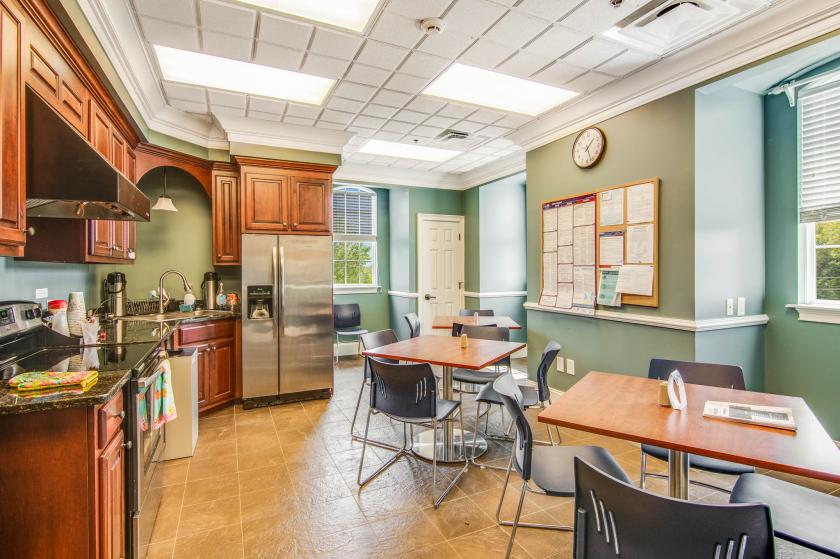
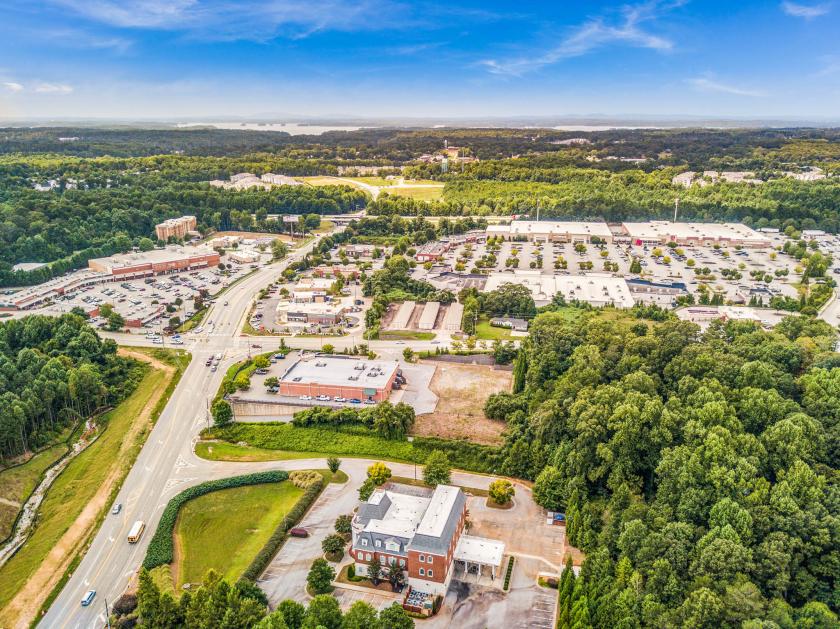
Office Space
5977 Spout Springs Road Flowery Branch, GA 30542
5977 Spout Springs Road Flowery Branch, GA 30542

Details & Description
Property Highlights
- • High Traffic Count
- • High Quality Building
- • 14 mile to Interstate 985
- • Lots of adaptive reuses.
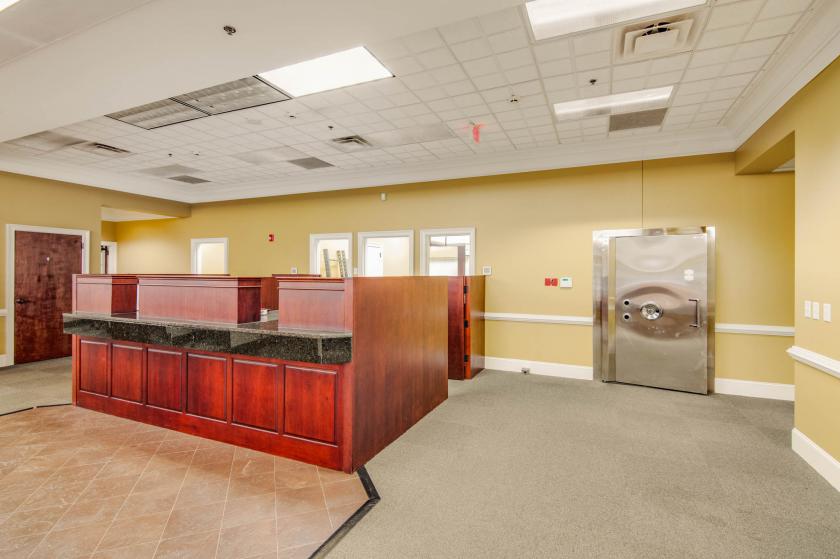
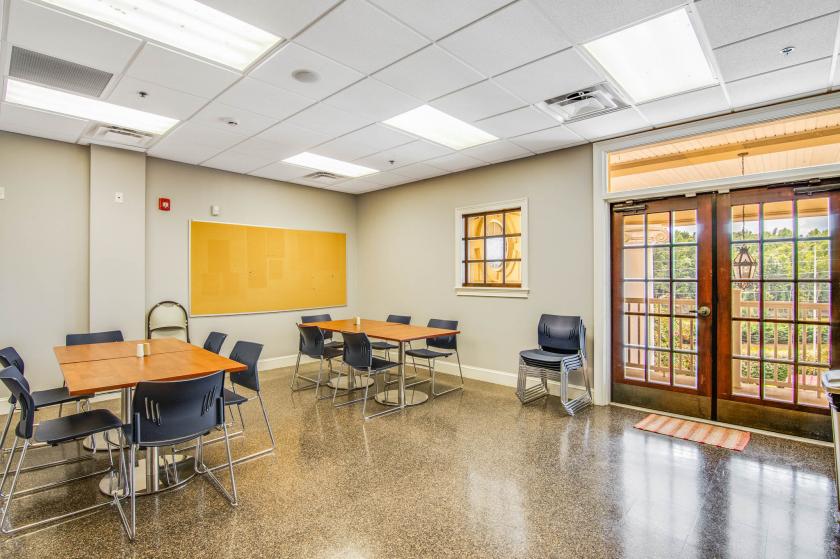
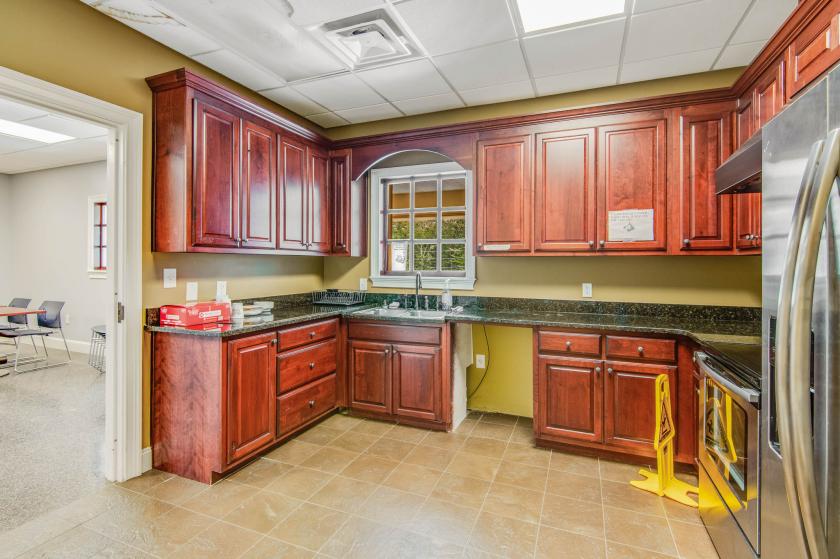
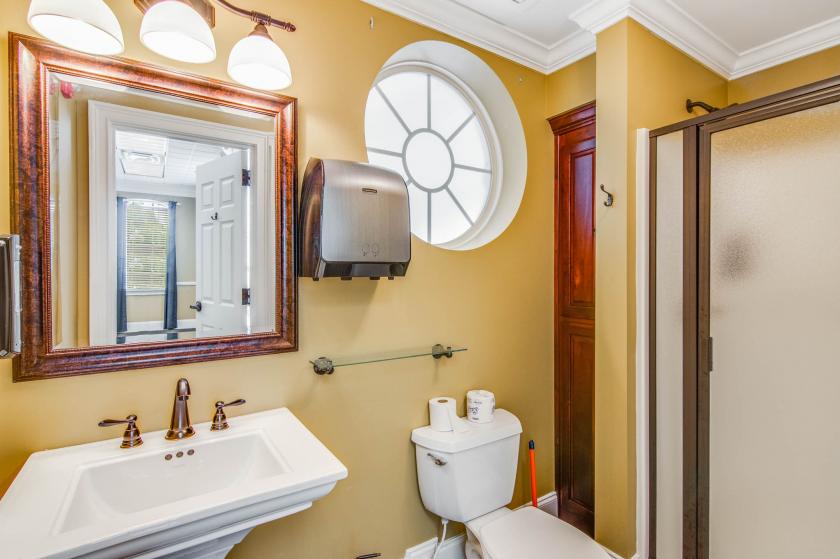
Additional Photos


Listing Agents
Ken Blankenship
KW Commercial
O: 678-318-5000
M: 770-289-8607
ken.blankenship@kw.com
KW Commercial
O: 678-318-5000
M: 770-289-8607
ken.blankenship@kw.com
While we strive to provide the most accurate information, all listing information, and demographic data, is provided by third-parties. As such, MyEListing will not be responsible for the accuracy of the information. It is strongly recommended that you verify all information with the listing agent, and any relevant agencies, prior to making any decisions.