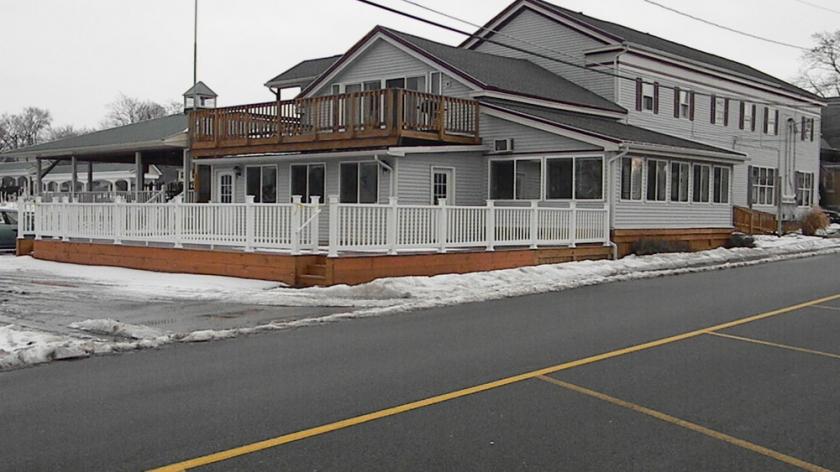
1-Mile | 3-Miles | 5-Miles | ||
---|---|---|---|---|
Total Population | 792 | 2,948 | 7,434 | |
Population Median Age | 41 | 42 | 43 | |
Population by Age | 0-9 Yrs | 41 (5%) | 182 (6%) | 600 (8%) |
10-19 Yrs | 167 (21%) | 520 (17%) | 1112 (14%) | |
20-29 Yrs | 68 (8%) | 239 (8%) | 608 (8%) | |
30-39 Yrs | 79 (9%) | 300 (10%) | 796 (10%) | |
40-49 Yrs | 141 (17%) | 493 (16%) | 1043 (14%) | |
50-59 Yrs | 113 (14%) | 462 (15%) | 1172 (15%) | |
60-69 Yrs | 93 (11%) | 391 (13%) | 993 (13%) | |
70+ Yrs | 90 (11%) | 361 (12%) | 1110 (14%) | |
Median HH Income | $60,597 | $63,049 | $57,274 | |
Total Household Income | < 24K | 54 (16%) | 181 (14%) | 506 (16%) |
25-49K | 101 (30%) | 330 (27%) | 819 (27%) | |
50-74K | 64 (19%) | 226 (18%) | 529 (17%) | |
75-99K | 20 (6%) | 141 (11%) | 331 (11%) | |
100-199K | 82 (25%) | 315 (25%) | 709 (23%) | |
200K+ | 6 (1%) | 26 (2%) | 95 (3%) | |
Highest Education Level | No Diploma | 20 | 122 | 575 |
Diploma or GED | 197 | 836 | 2054 | |
Some College | 122 | 414 | 986 | |
Assoc. Degree | 135 | 365 | 619 | |
Bachelors Degree | 25 | 240 | 691 | |
Higher Degree | 29 | 130 | 505 | |
Total Housing Units | 452 | 1,553 | 3,464 | |
--Owner-Occupied | 248 | 1,021 | 2,499 | |
--Renter-Occupied | 79 | 198 | 490 | |
Owner-Occupied Values | < 100K | 104 | 408 | 908 |
100-199K | 100 | 420 | 1103 | |
200-299K | 26 | 114 | 251 | |
300-399K | 8 | 50 | 118 | |
400-499K | 9 | 28 | 87 | |
500K+ | 0 | 1 | 33 | |
Total Working Age Population | 664 | 2,474 | 6,197 | |
In Work Force | 464 | 1,608 | 3,630 | |
Not In Work Force | 200 | 866 | 2,566 | |
Workforce Employed | 412 | 1,477 | 3,350 | |
Workforce Unemployed | 44 | 116 | 265 | |
Civlian Workforce | 456 | 1,593 | 3,616 | |
Military Workforce | 8 | 14 | 15 | |
Total Households | 327 | 1,218 | 2,989 | |
Family Households | 177 | 754 | 2,031 | |
Non-Family Households | 149 | 464 | 958 | |
Married Couple | 134 | 624 | 1,649 | |
Other Family | 44 | 130 | 382 | |
Married w/Child | 69 | 257 | 577 | |
Single Male w/Child | 5 | 10 | 11 | |
Single Female w/Child | 24 | 70 | 140 |
Population Change Last Two Decades - Plus Projection
2000 | % | 2010 | % | 2020 | % | 2030 | |
---|---|---|---|---|---|---|---|
New York | 18,976,457 | +2 | 19,378,102 | +4 | 20,146,131 | +2 | 20,604,030 |
Niagara County | 219,846 | -2 | 216,469 | -3 | 209,940 | -3 | 202,950 |
Total Working Age Population:
Total Households:
Total Working Age Population:
Total Households:
Total Working Age Population:
Total Households: