Industrial Properties
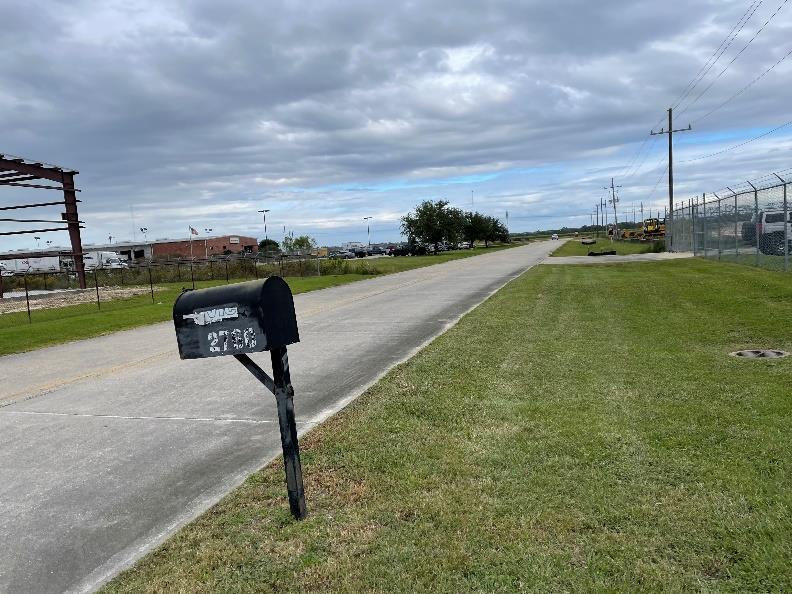
2760 Sugarhouse Road Port Allen, LA 70767
2760 Sugarhouse Road Port Allen, LA 70767

Details & Description
Property Highlights
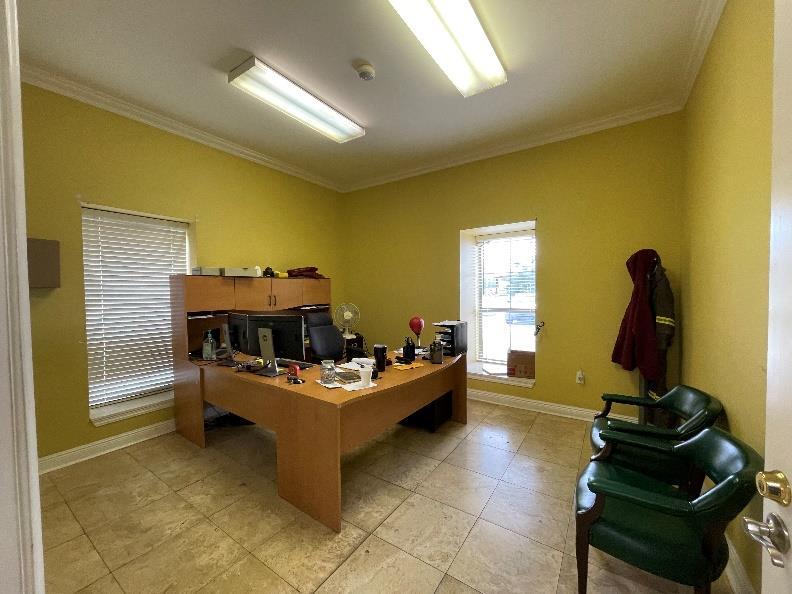
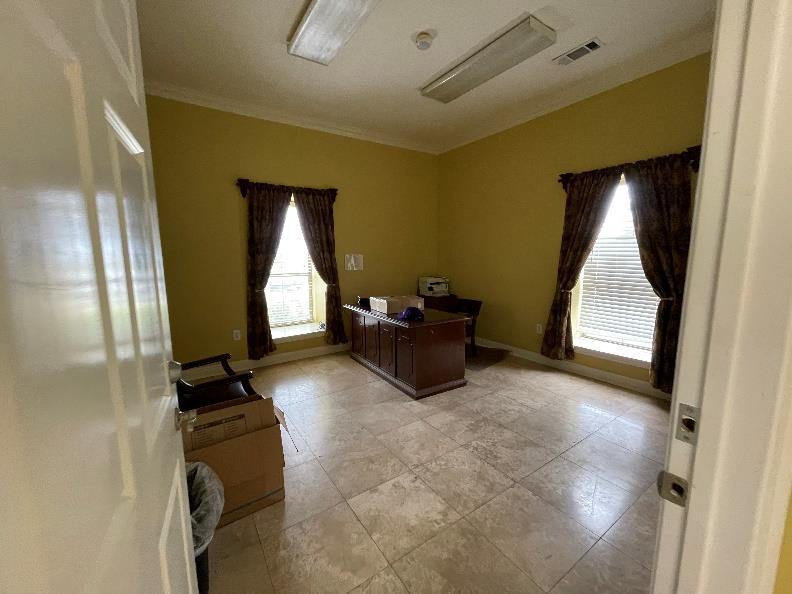
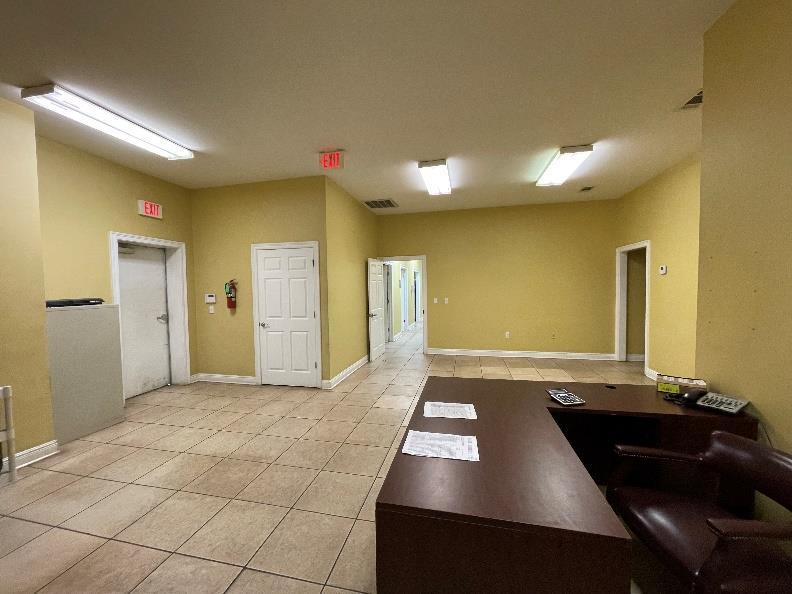
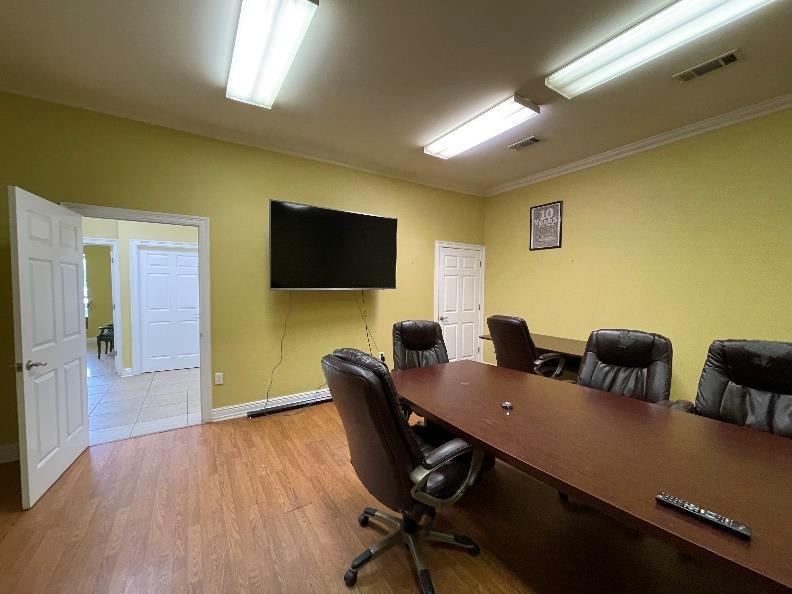
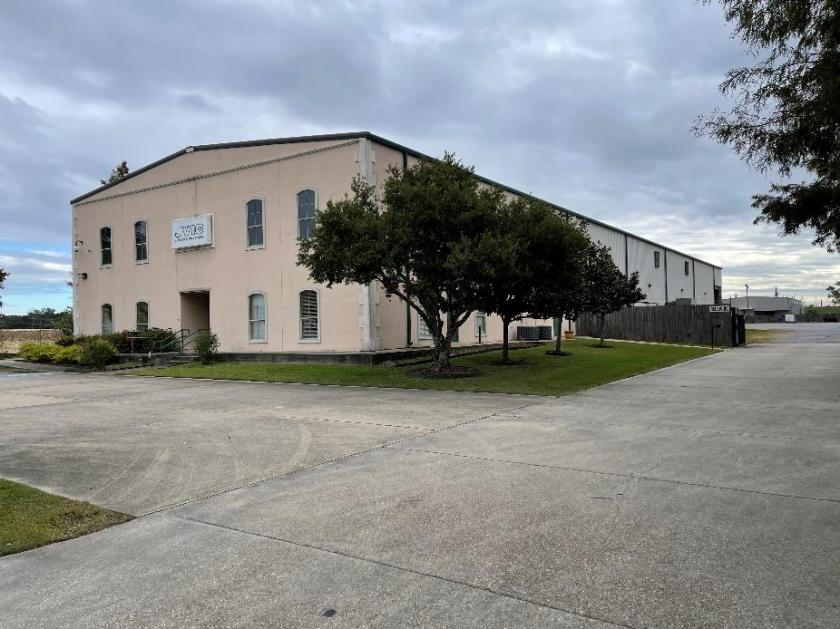
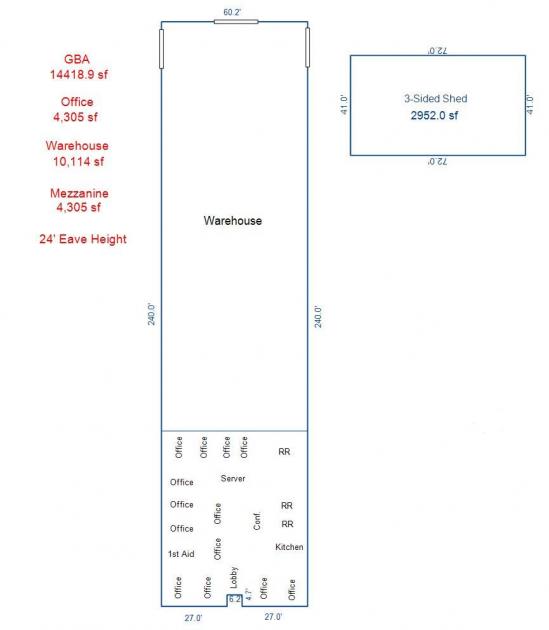
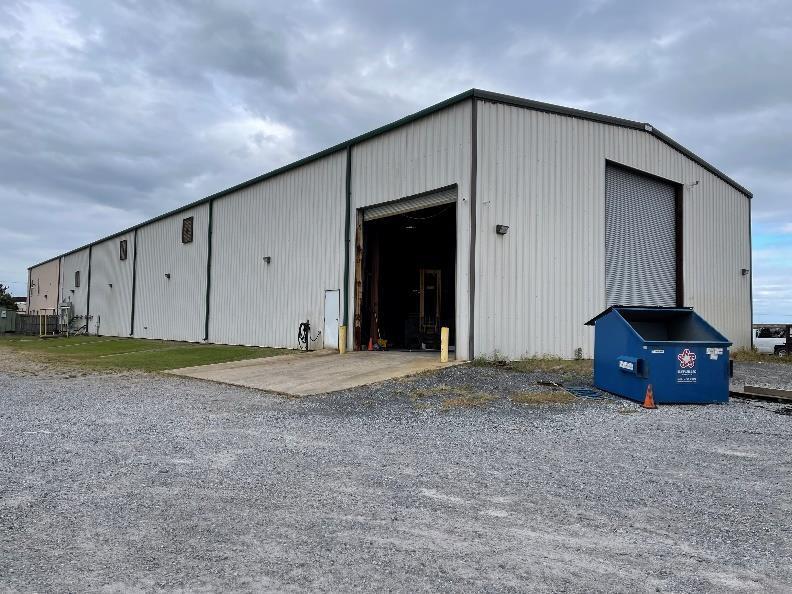
- • 4,305 sqft Office Space
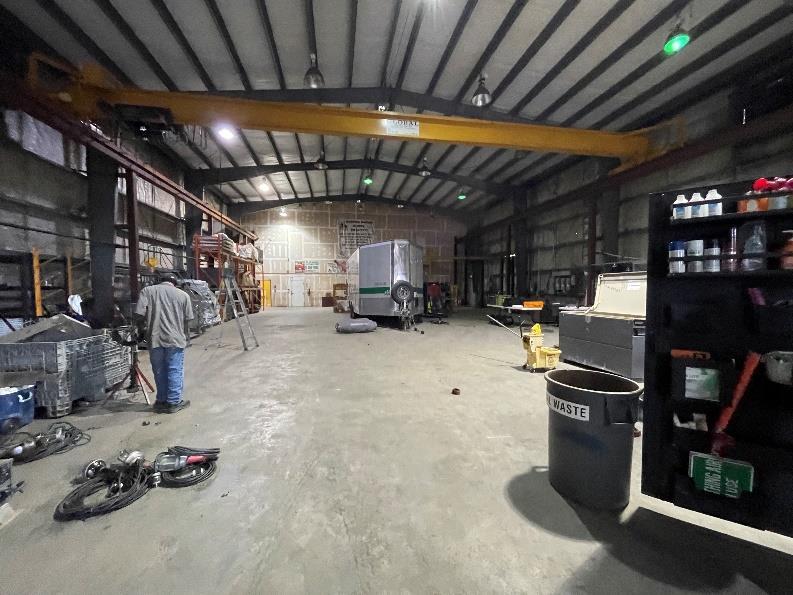
- • 10,114 sqft Warehouse
- • 4,305 sqft Mezzanine
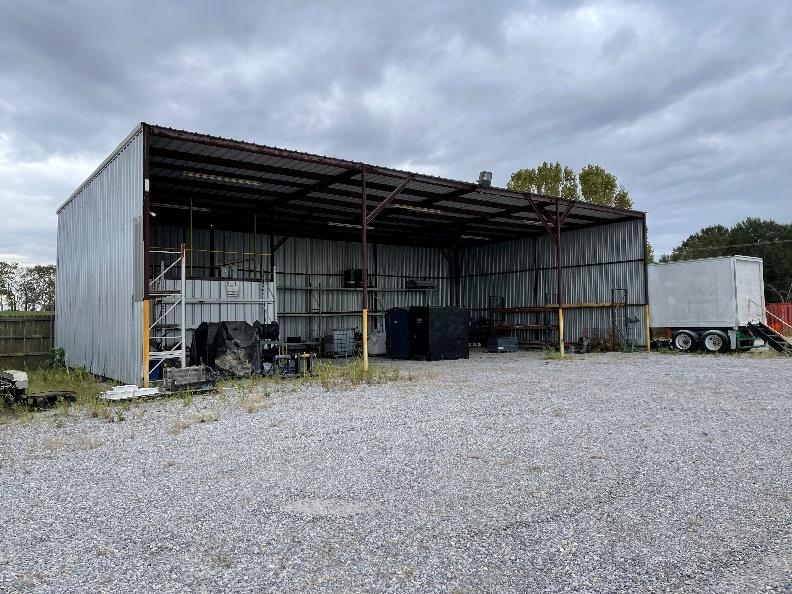
- • 2,952 sqft 3-Sided Shed
- • 24 Eave Height
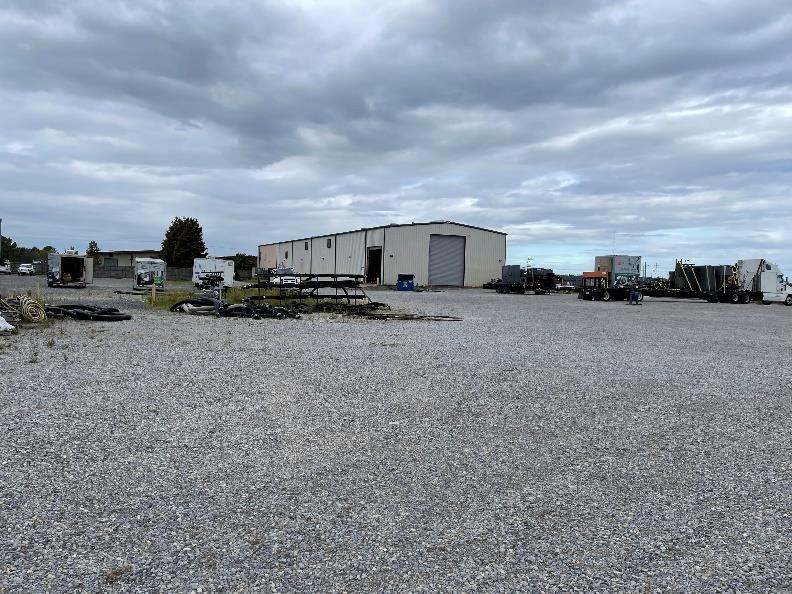
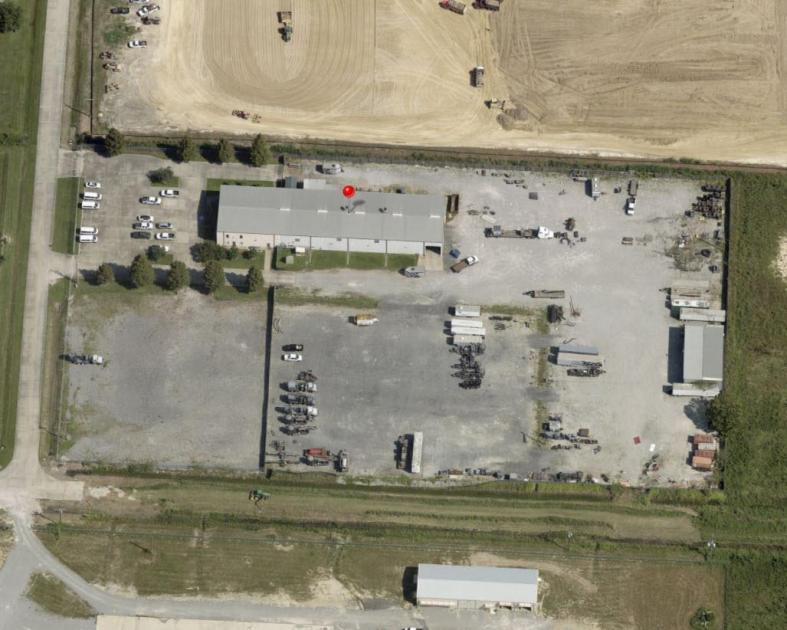
- • 4.6 acres of fenced stabilized yard
Additional Photos
Listing Agents

Aline Moreaux
aline.moreaux@gmail.com
aline.moreaux@gmail.com
While we strive to provide the most accurate information, all listing information, and demographic data, is provided by third-parties. As such, MyEListing will not be responsible for the accuracy of the information. It is strongly recommended that you verify all information with the listing agent, and any relevant agencies, prior to making any decisions.