Commercial Land
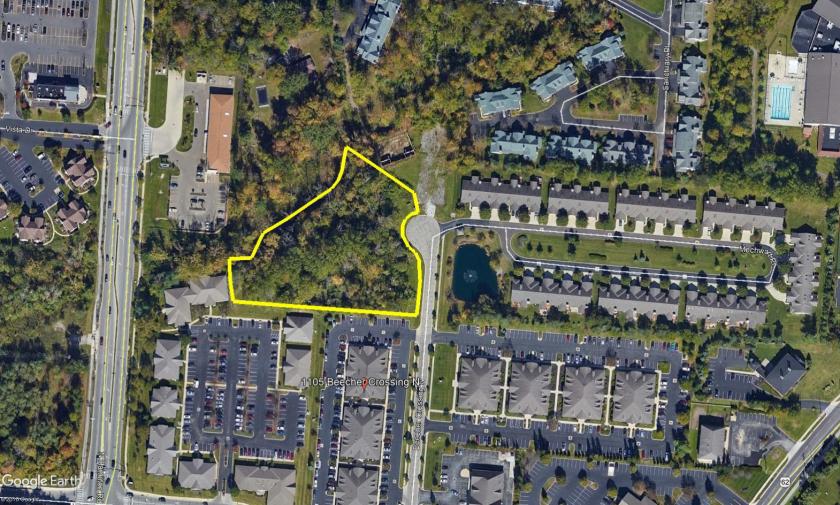
1085 Beecher Crossing N Gahanna, OH 43230
1085 Beecher Crossing N Gahanna, OH 43230
Details & Description
Property Highlights
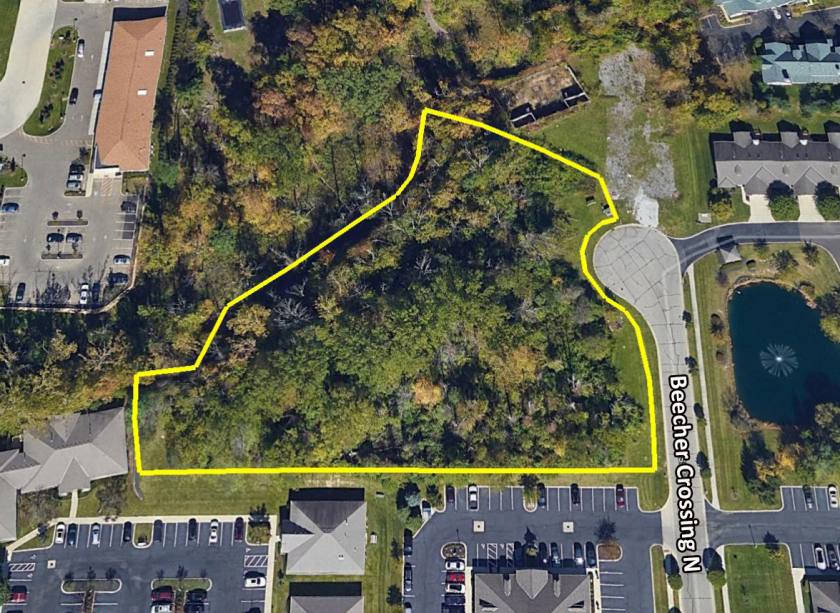
- • WOODED LOT
- • PRIVATE AND SECLUDED LOCATION
- • ALL UTILITIES AVAILABLE
Additional Photos


Listing Agents

Skip Weiler
O: 614-221-4286
skip@rweiler.com
O: 614-221-4286
skip@rweiler.com
While we strive to provide the most accurate information, all listing information, and demographic data, is provided by third-parties. As such, MyEListing will not be responsible for the accuracy of the information. It is strongly recommended that you verify all information with the listing agent, and any relevant agencies, prior to making any decisions.