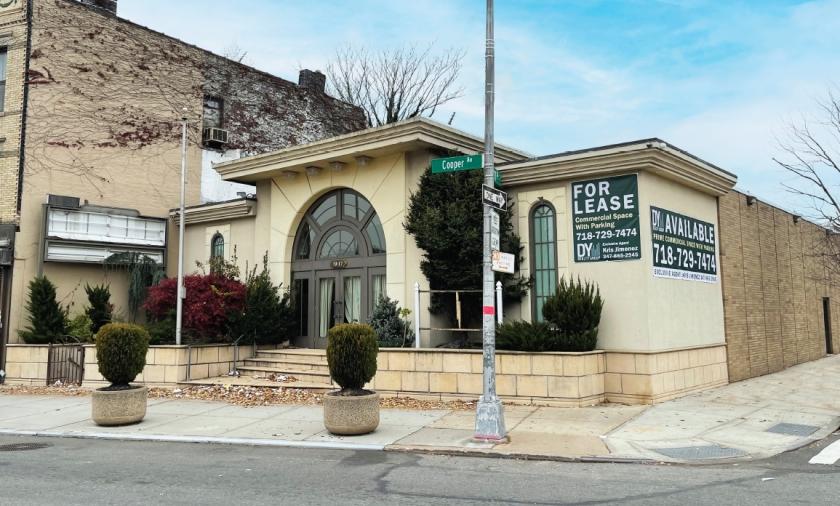
Office Space
70-17 Cooper Avenue Queens, NY 11385
70-17 Cooper Avenue Queens, NY 11385
Details & Description
Property Highlights
- • Corner location
- • 10,000 sf 5,000 sf on 1st 5,000 sf LL
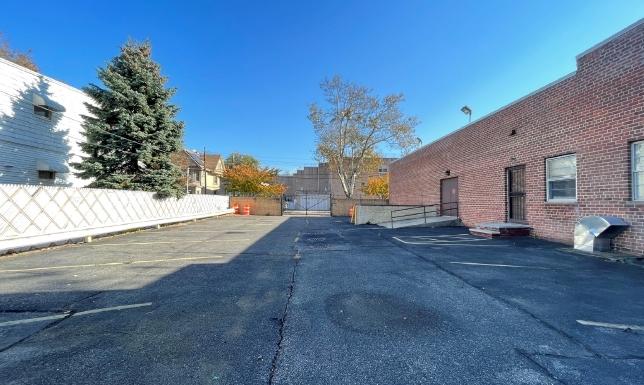
- • 4,800 sf of private parking
- • 400 person occupancy
Additional Photos


Listing Agents

Kris Jimenez
O: 718-729-7474
M: 347-865-2945
kjimenez@dyrealty.com
O: 718-729-7474
M: 347-865-2945
kjimenez@dyrealty.com
While we strive to provide the most accurate information, all listing information, and demographic data, is provided by third-parties. As such, MyEListing will not be responsible for the accuracy of the information. It is strongly recommended that you verify all information with the listing agent, and any relevant agencies, prior to making any decisions.


