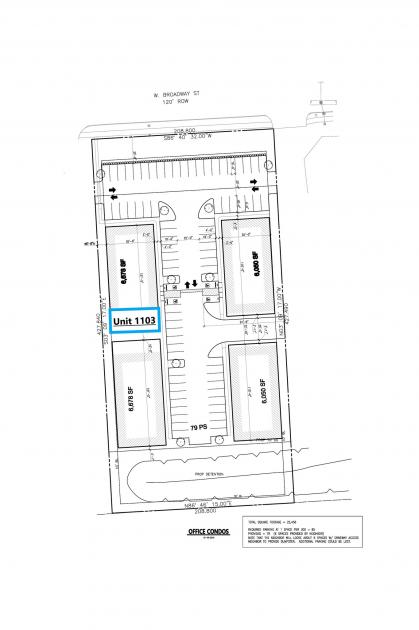
1-Mile | 3-Miles | 5-Miles | ||
---|---|---|---|---|
Total Population | 12,500 | 70,311 | 182,401 | |
Population Median Age | 34 | 34 | 33 | |
Population by Age | 0-9 Yrs | 2080 (16%) | 11690 (16%) | 29827 (16%) |
10-19 Yrs | 1429 (11%) | 9691 (13%) | 27277 (14%) | |
20-29 Yrs | 1305 (10%) | 7853 (11%) | 23808 (13%) | |
30-39 Yrs | 3017 (24%) | 14044 (19%) | 32142 (17%) | |
40-49 Yrs | 2070 (16%) | 10600 (15%) | 25741 (14%) | |
50-59 Yrs | 1233 (9%) | 8006 (11%) | 20326 (11%) | |
60-69 Yrs | 602 (4%) | 4419 (6%) | 13811 (7%) | |
70+ Yrs | 765 (6%) | 4010 (5%) | 9468 (5%) | |
Median HH Income | $111,876 | $104,009 | $84,292 | |
Total Household Income | < 24K | 161 (3%) | 1736 (7%) | 6415 (11%) |
25-49K | 426 (9%) | 2616 (11%) | 9960 (17%) | |
50-74K | 612 (14%) | 3452 (14%) | 9432 (16%) | |
75-99K | 675 (15%) | 3502 (14%) | 8465 (14%) | |
100-199K | 1767 (40%) | 8931 (37%) | 18424 (31%) | |
200K+ | 699 (16%) | 3321 (14%) | 5212 (9%) | |
Highest Education Level | No Diploma | 447 | 3429 | 15373 |
Diploma or GED | 800 | 6083 | 23315 | |
Some College | 1203 | 8781 | 24709 | |
Assoc. Degree | 651 | 3228 | 7839 | |
Bachelors Degree | 3164 | 14234 | 26470 | |
Higher Degree | 2387 | 10061 | 17437 | |
Total Housing Units | 4,488 | 24,809 | 61,227 | |
--Owner-Occupied | 2,742 | 16,719 | 41,139 | |
--Renter-Occupied | 1,599 | 6,839 | 16,769 | |
Owner-Occupied Values | < 100K | 53 | 807 | 7347 |
100-199K | 155 | 2936 | 11923 | |
200-299K | 1226 | 6526 | 12585 | |
300-399K | 882 | 4596 | 6389 | |
400-499K | 328 | 1303 | 1646 | |
500K+ | 98 | 552 | 1249 | |
Total Working Age Population | 9,444 | 52,052 | 134,891 | |
In Work Force | 7,206 | 38,347 | 95,365 | |
Not In Work Force | 2,238 | 13,706 | 39,527 | |
Workforce Employed | 6,965 | 36,930 | 90,778 | |
Workforce Unemployed | 215 | 1,269 | 4,356 | |
Civlian Workforce | 7,180 | 38,199 | 95,134 | |
Military Workforce | 26 | 148 | 231 | |
Total Households | 4,341 | 23,558 | 57,908 | |
Family Households | 3,162 | 17,471 | 43,429 | |
Non-Family Households | 1,178 | 6,087 | 14,478 | |
Married Couple | 2,883 | 14,954 | 32,618 | |
Other Family | 279 | 2,518 | 10,811 | |
Married w/Child | 1,771 | 8,903 | 18,147 | |
Single Male w/Child | 21 | 320 | 1,016 | |
Single Female w/Child | 107 | 1,118 | 4,686 |
Population Change Last Two Decades - Plus Projection
2000 | % | 2010 | % | 2020 | % | 2030 | |
---|---|---|---|---|---|---|---|
Texas | 20,851,820 | +21 | 25,145,561 | +18 | 29,677,668 | +18 | 34,894,452 |
Brazoria County | 241,767 | +30 | 313,166 | +20 | 375,869 | +20 | 452,517 |
Fort Bend County | 354,452 | +65 | 585,375 | +44 | 840,383 | +43 | 1,203,029 |
Harris County | 3,400,578 | +20 | 4,092,459 | +22 | 4,978,845 | +19 | 5,924,750 |
Total Working Age Population:
Total Households:
Total Working Age Population:
Total Households:
Total Working Age Population:
Total Households: