Office Space
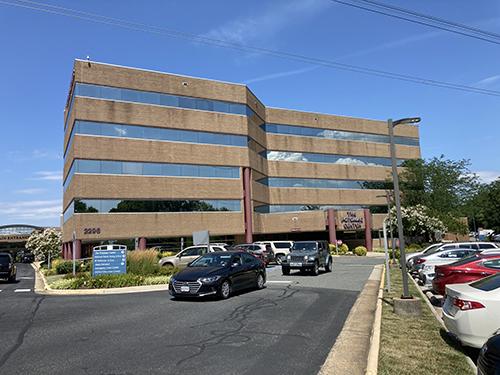
2296 Opitz Boulevard Woodbridge, VA 22191
2296 Opitz Boulevard Woodbridge, VA 22191
Details & Description
Property Highlights
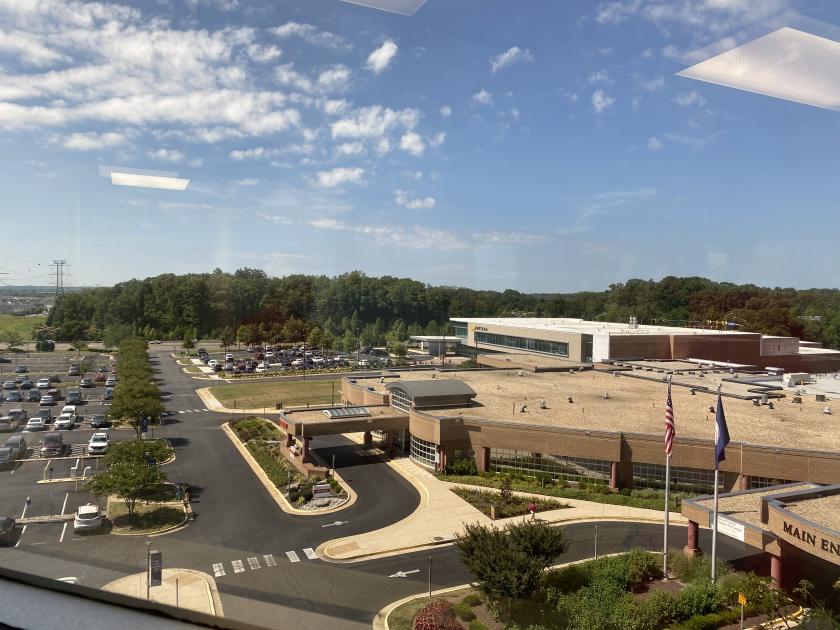
• Located next to Sentara Hospital Campus
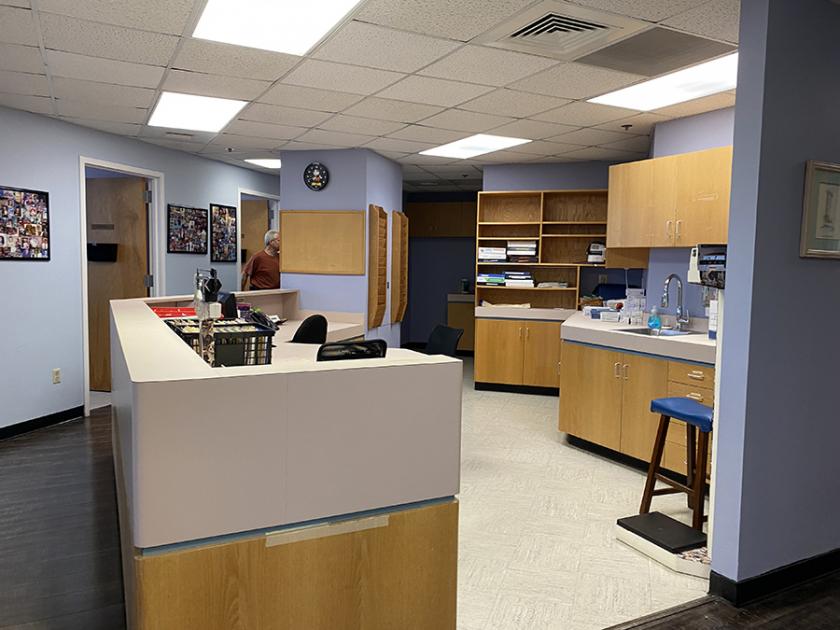
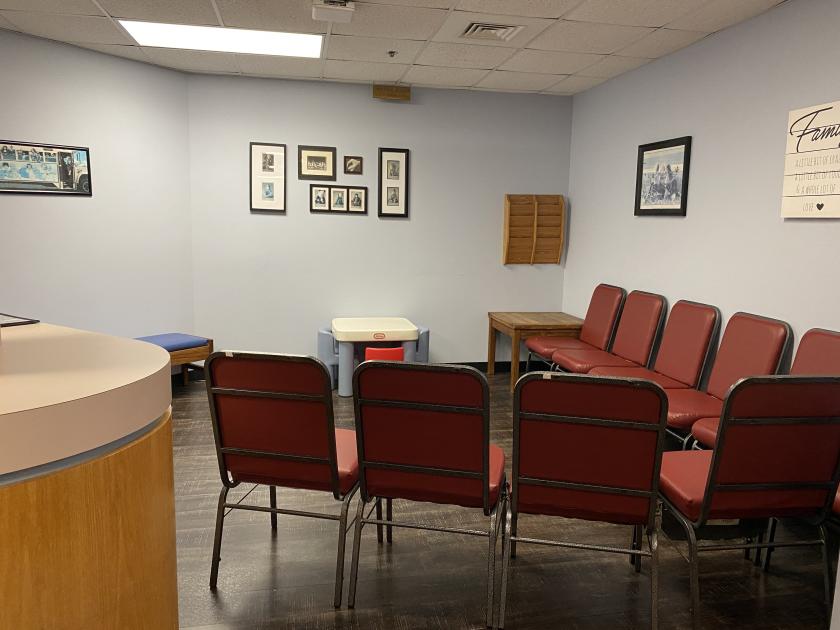
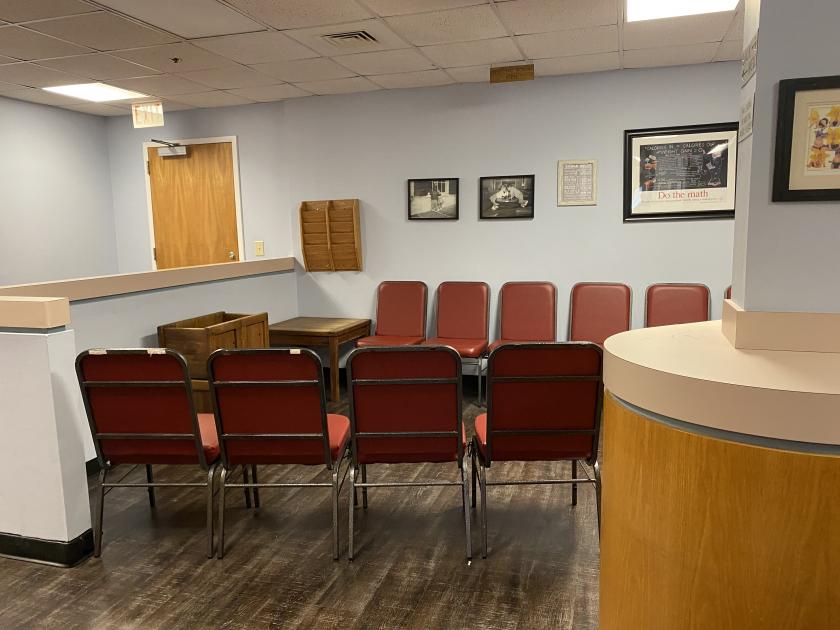
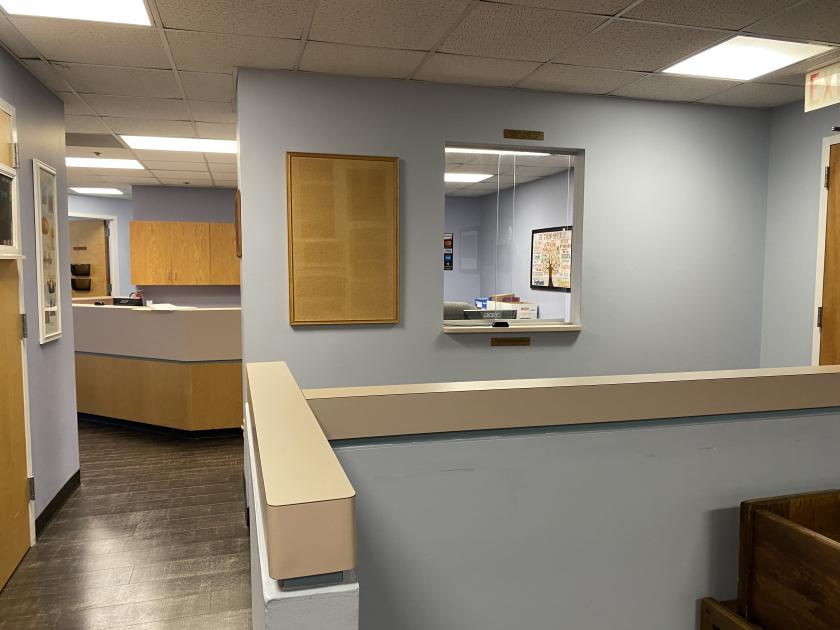
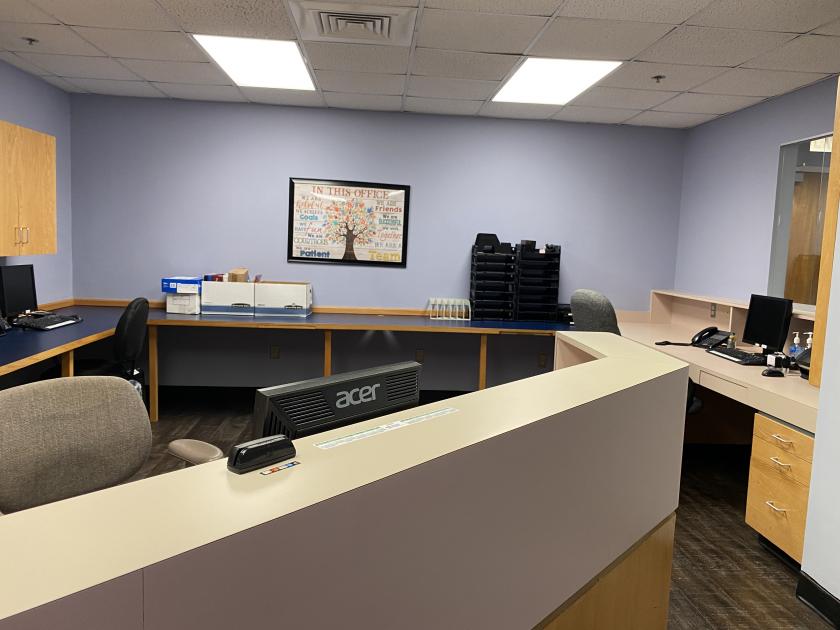
• Fully Equipped Medical Office Condo
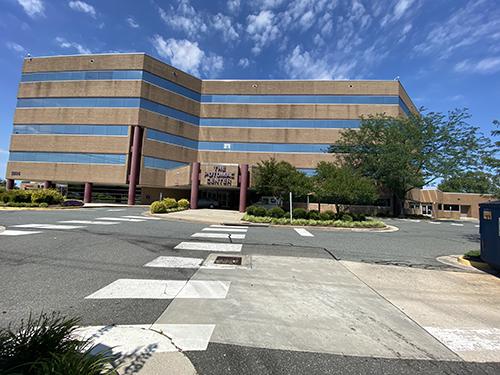
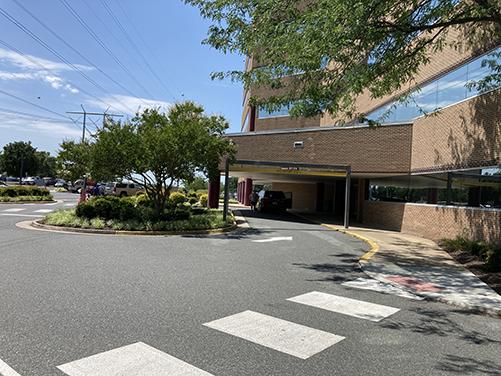
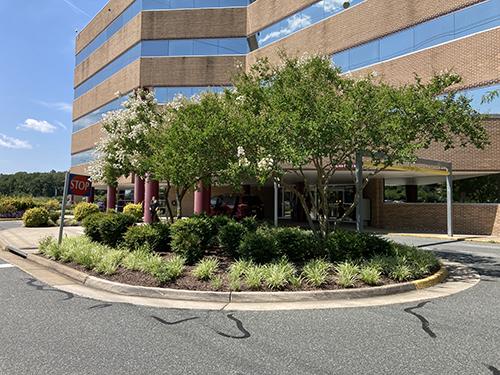
Additional Photos

Listing Agents

Ed Cave
O: 703-537-3311
M: 703-919-2149
ecave@mcenearney.com
O: 703-537-3311
M: 703-919-2149
ecave@mcenearney.com
While we strive to provide the most accurate information, all listing information, and demographic data, is provided by third-parties. As such, MyEListing will not be responsible for the accuracy of the information. It is strongly recommended that you verify all information with the listing agent, and any relevant agencies, prior to making any decisions.