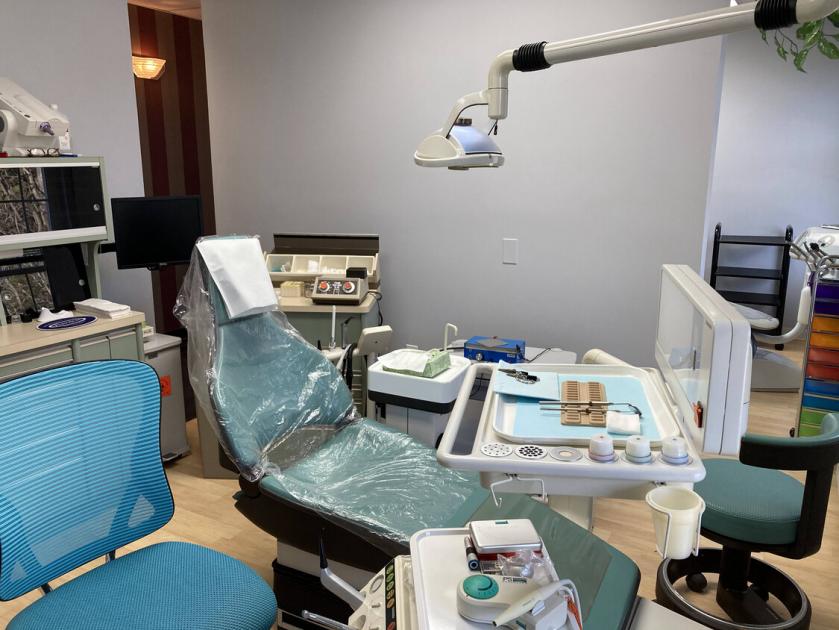
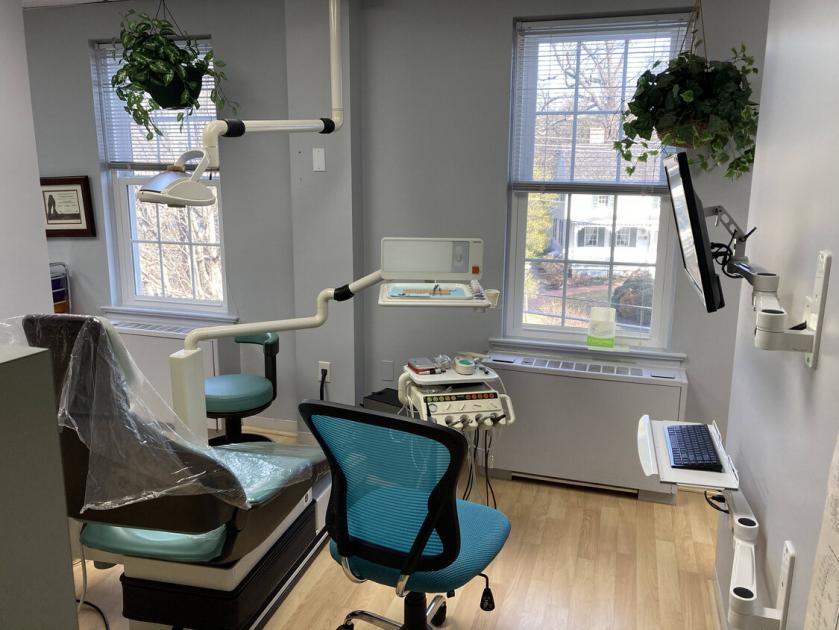
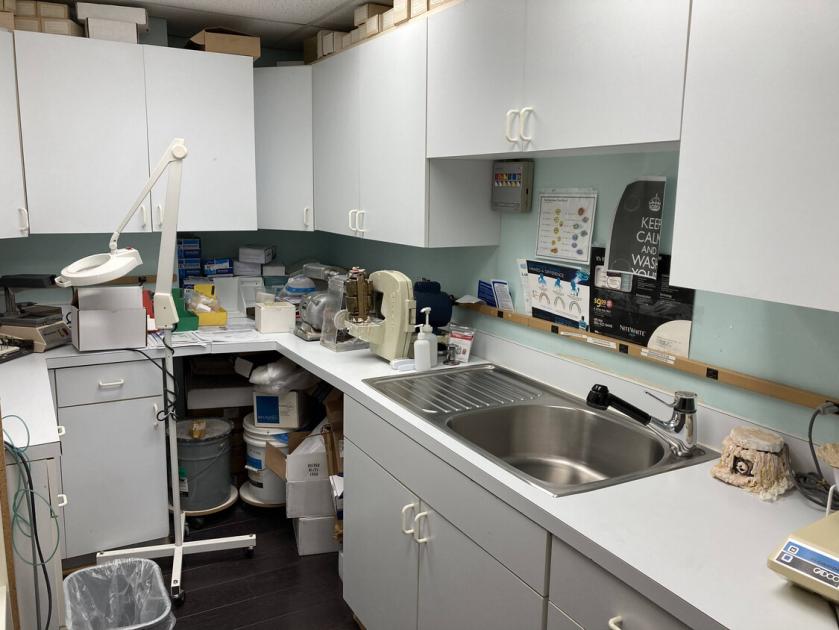
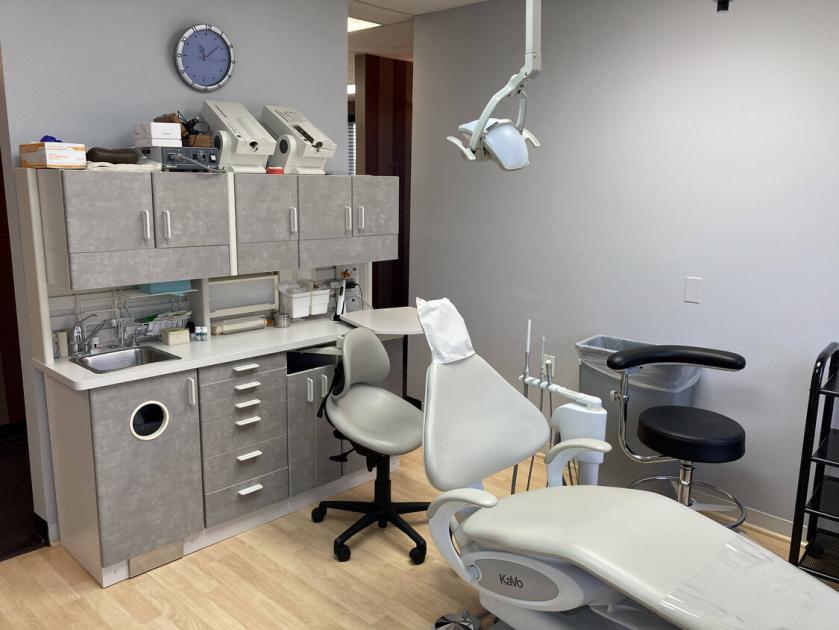
Office Space
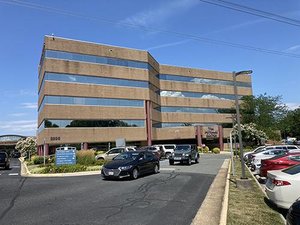
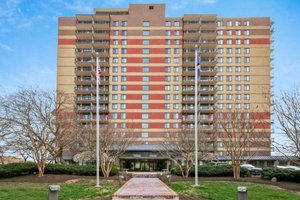
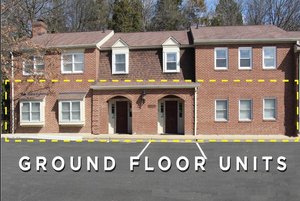
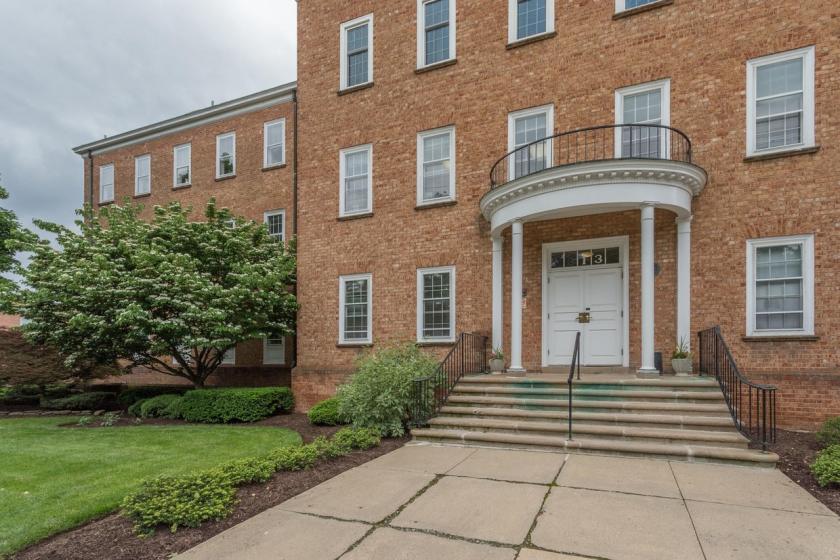
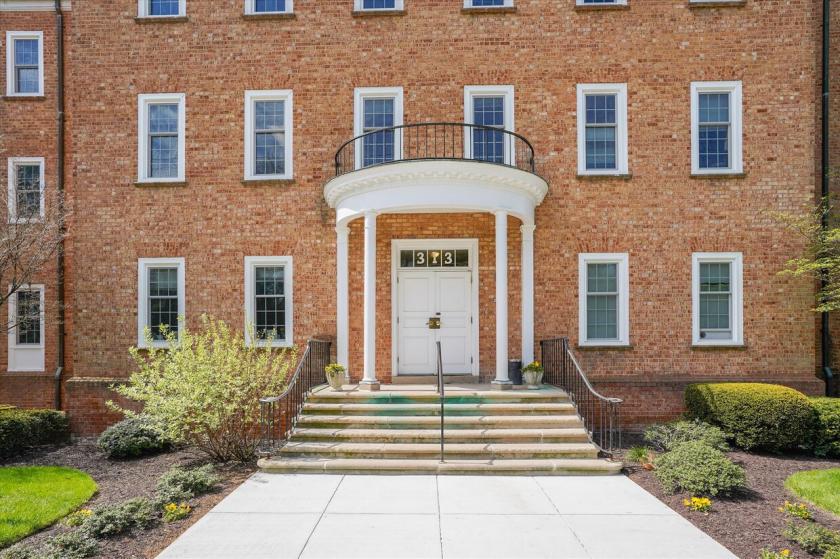
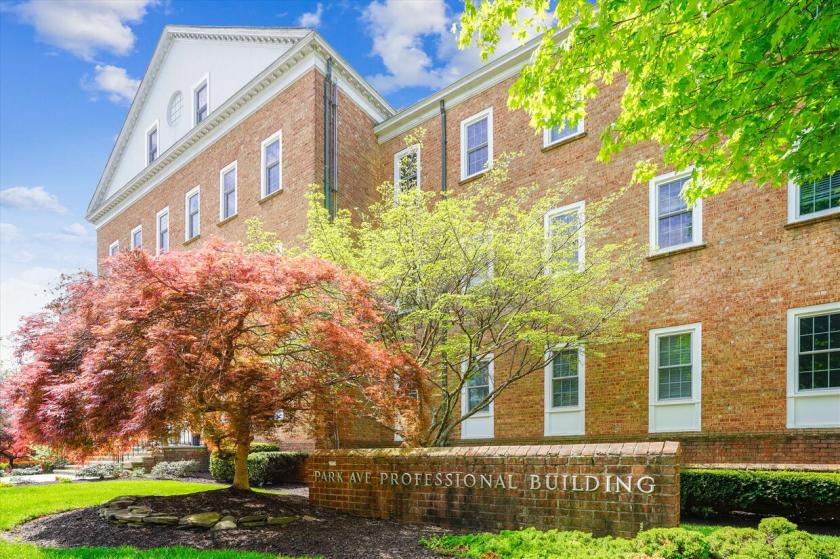
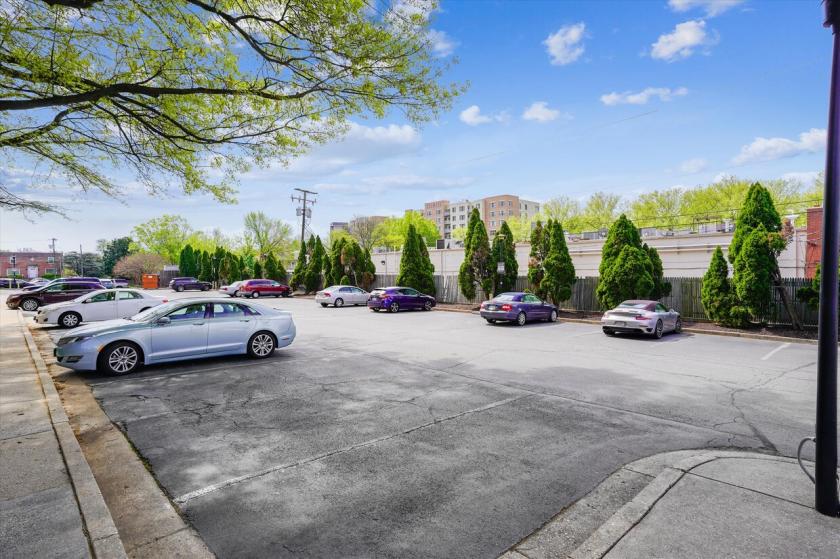
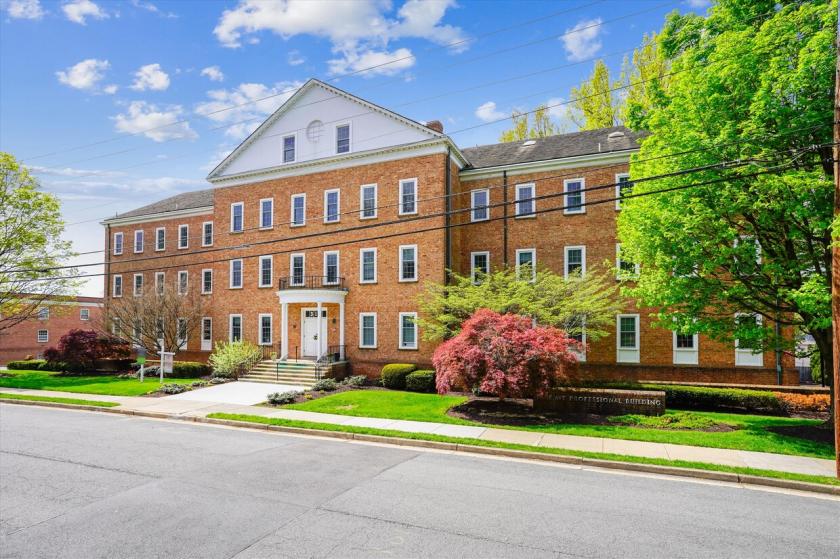
313 Park Avenue Falls Church, VA 22046
313 Park Avenue Falls Church, VA 22046
Details & Description
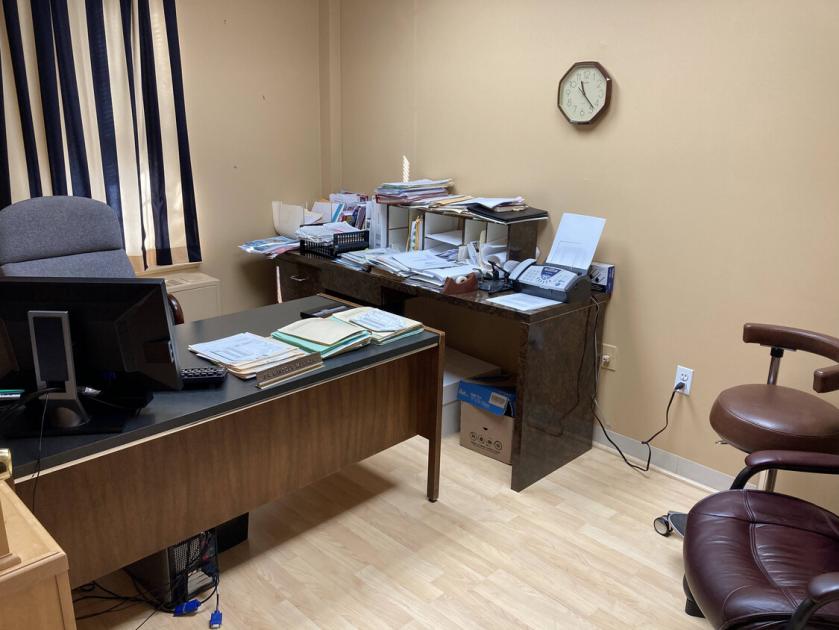
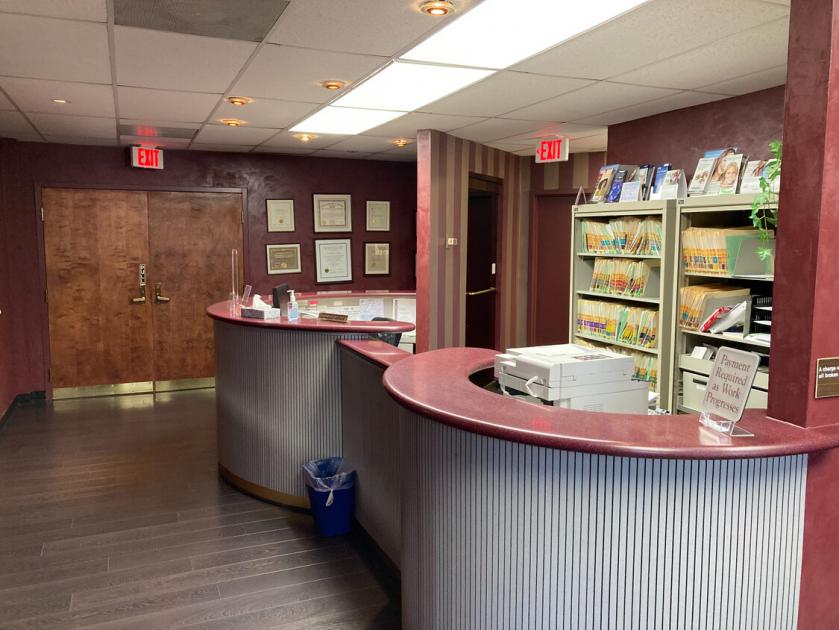
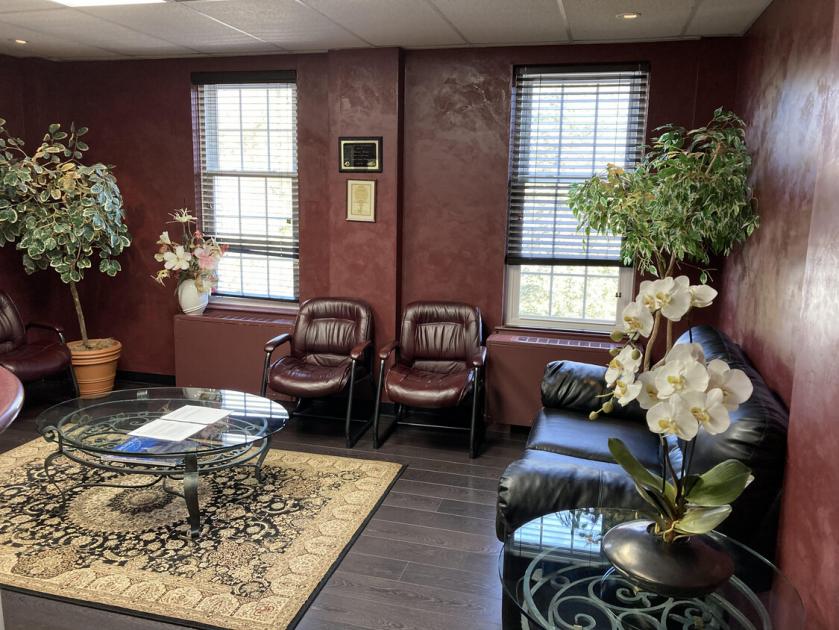
Additional Photos
Listing Agents

Ed Cave
O: 703-537-3311
M: 703-919-2149
ecave@mcenearney.com
O: 703-537-3311
M: 703-919-2149
ecave@mcenearney.com
While we strive to provide the most accurate information, all listing information, and demographic data, is provided by third-parties. As such, MyEListing will not be responsible for the accuracy of the information. It is strongly recommended that you verify all information with the listing agent, and any relevant agencies, prior to making any decisions.