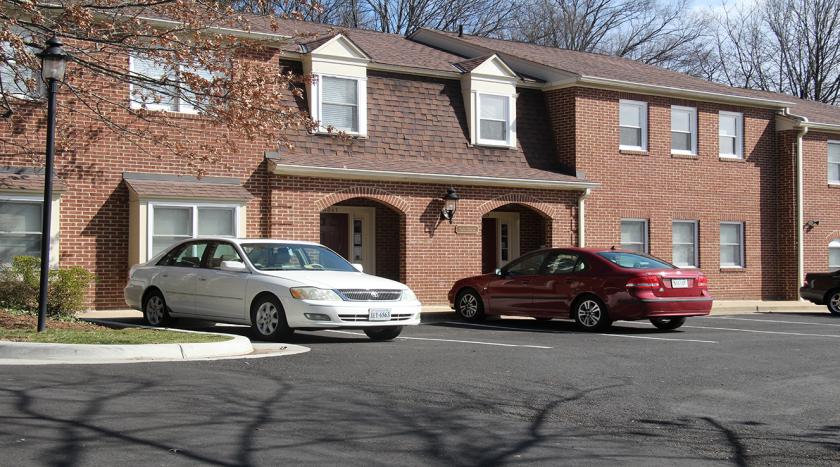
Office Space
3341 Duke Street Alexandria, VA 22314
3341 Duke Street Alexandria, VA 22314

Details & Description
Property Highlights
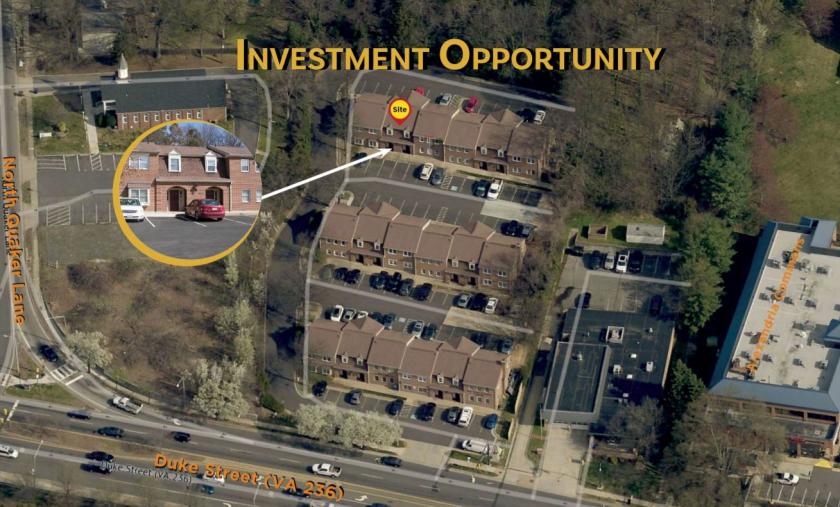
• The Landmark site will also be the home of the Future INOVA Alexandria Hospital Campus and Transportation Hub.
• Convenient to Capital Beltway, Old Town Alexandria and to many local area restaurants and shops.
Listing Agents

Ed Cave
O: 703-537-3311
M: 703-919-2149
ecave@mcenearney.com
O: 703-537-3311
M: 703-919-2149
ecave@mcenearney.com
While we strive to provide the most accurate information, all listing information, and demographic data, is provided by third-parties. As such, MyEListing will not be responsible for the accuracy of the information. It is strongly recommended that you verify all information with the listing agent, and any relevant agencies, prior to making any decisions.