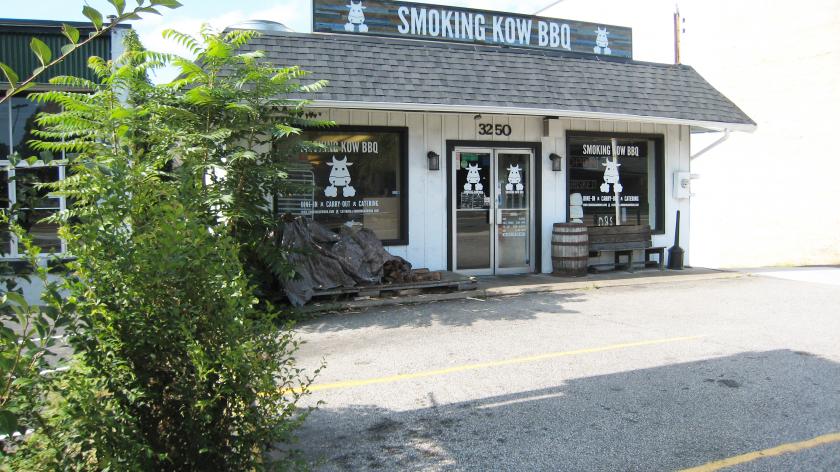
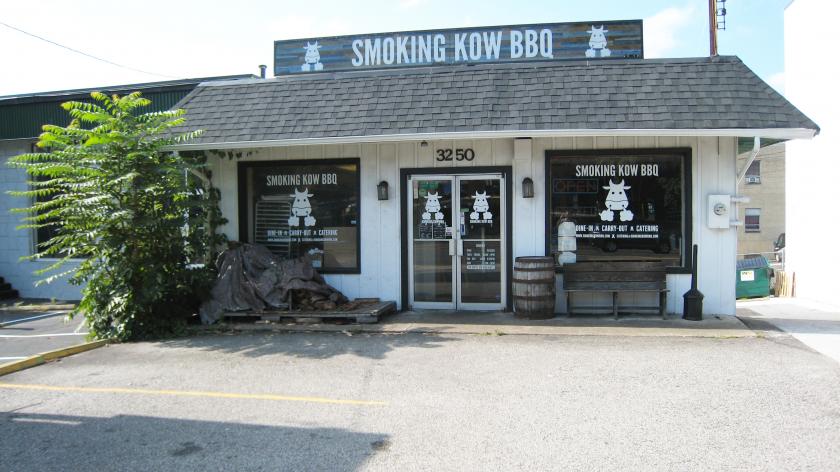
1-Mile | 3-Miles | 5-Miles | ||
---|---|---|---|---|
Total Population | 14,950 | 237,971 | 515,293 | |
Population Median Age | 39 | 38 | 37 | |
Population by Age | 0-9 Yrs | 1530 (10%) | 28144 (11%) | 66328 (12%) |
10-19 Yrs | 1543 (10%) | 19140 (8%) | 47945 (9%) | |
20-29 Yrs | 1891 (12%) | 34580 (14%) | 76783 (14%) | |
30-39 Yrs | 3023 (20%) | 51485 (21%) | 102970 (19%) | |
40-49 Yrs | 2210 (14%) | 34900 (14%) | 72268 (14%) | |
50-59 Yrs | 1921 (12%) | 29146 (12%) | 62341 (12%) | |
60-69 Yrs | 1619 (10%) | 22693 (9%) | 48744 (9%) | |
70+ Yrs | 1211 (8%) | 17882 (7%) | 37914 (7%) | |
Median HH Income | $124,338 | $103,170 | $97,672 | |
Total Household Income | < 24K | 274 (4%) | 9222 (8%) | 23108 (10%) |
25-49K | 687 (11%) | 12310 (11%) | 27709 (12%) | |
50-74K | 463 (7%) | 14996 (14%) | 30177 (14%) | |
75-99K | 714 (11%) | 14360 (13%) | 28588 (13%) | |
100-199K | 2331 (38%) | 34575 (32%) | 68402 (31%) | |
200K+ | 1577 (26%) | 19416 (18%) | 35861 (16%) | |
Highest Education Level | No Diploma | 698 | 12976 | 34643 |
Diploma or GED | 1532 | 21002 | 52536 | |
Some College | 982 | 22874 | 49355 | |
Assoc. Degree | 672 | 9607 | 20290 | |
Bachelors Degree | 3182 | 53679 | 106176 | |
Higher Degree | 4200 | 58555 | 108826 | |
Total Housing Units | 6,527 | 113,365 | 229,857 | |
--Owner-Occupied | 3,564 | 49,709 | 99,208 | |
--Renter-Occupied | 2,482 | 55,170 | 114,636 | |
Owner-Occupied Values | < 100K | 77 | 732 | 2081 |
100-199K | 105 | 2609 | 5970 | |
200-299K | 185 | 6009 | 11618 | |
300-399K | 523 | 7535 | 15659 | |
400-499K | 534 | 8157 | 16973 | |
500K+ | 2141 | 24667 | 46906 | |
Total Working Age Population | 12,421 | 197,634 | 418,832 | |
In Work Force | 9,695 | 153,099 | 317,875 | |
Not In Work Force | 2,726 | 44,534 | 100,957 | |
Workforce Employed | 9,117 | 144,206 | 295,867 | |
Workforce Unemployed | 322 | 4,617 | 12,017 | |
Civlian Workforce | 9,439 | 148,823 | 307,884 | |
Military Workforce | 256 | 4,276 | 9,991 | |
Total Households | 6,046 | 104,879 | 213,844 | |
Family Households | 3,427 | 52,341 | 114,066 | |
Non-Family Households | 2,619 | 52,538 | 99,778 | |
Married Couple | 2,756 | 40,039 | 84,758 | |
Other Family | 670 | 12,302 | 29,308 | |
Married w/Child | 1,272 | 17,157 | 37,727 | |
Single Male w/Child | 79 | 1,228 | 3,099 | |
Single Female w/Child | 261 | 4,500 | 11,166 |
Population Change Last Two Decades - Plus Projection
2000 | % | 2010 | % | 2020 | % | 2030 | |
---|---|---|---|---|---|---|---|
District of Columbia | 572,059 | +5 | 601,723 | +21 | 729,501 | +15 | 842,154 |
Maryland | 5,296,486 | +9 | 5,773,552 | +6 | 6,141,900 | +6 | 6,518,750 |
Prince Georges County | 801,515 | +8 | 863,420 | +6 | 916,150 | +4 | 952,950 |
Virginia | 7,078,515 | +13 | 8,001,024 | +8 | 8,655,021 | +8 | 9,331,666 |
Arlington County | 189,453 | +10 | 207,627 | +20 | 249,298 | +10 | 274,339 |
Fairfax County | 969,749 | +12 | 1,081,726 | +7 | 1,162,504 | +7 | 1,244,025 |
Alexandria city | 128,283 | +9 | 139,966 | +19 | 166,261 | +10 | 182,067 |
Total Working Age Population:
Total Households:
Total Working Age Population:
Total Households:
Total Working Age Population:
Total Households: