Industrial Properties
720 Grandview Avenue Columbus, OH 43215
720 Grandview Avenue Columbus, OH 43215

Details & Description
Property Highlights
- • GREAT GRANDVIEW LOCATION
- • OPPORTUNITY ZONE
- • 2 DRIVE-IN DOORS
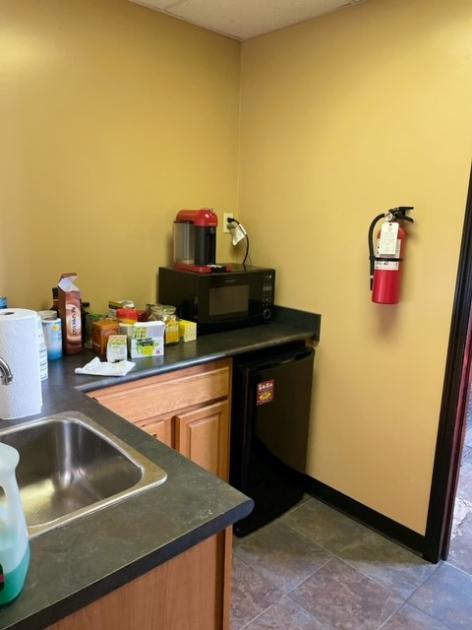
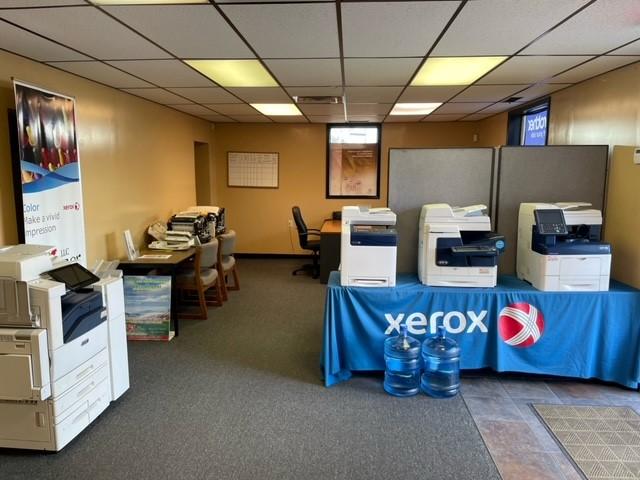
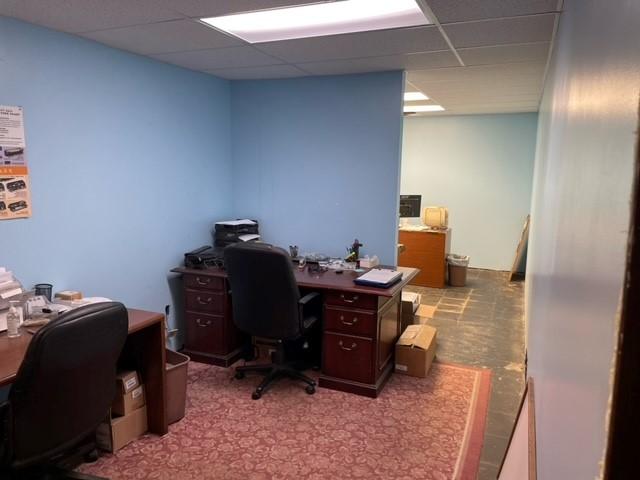
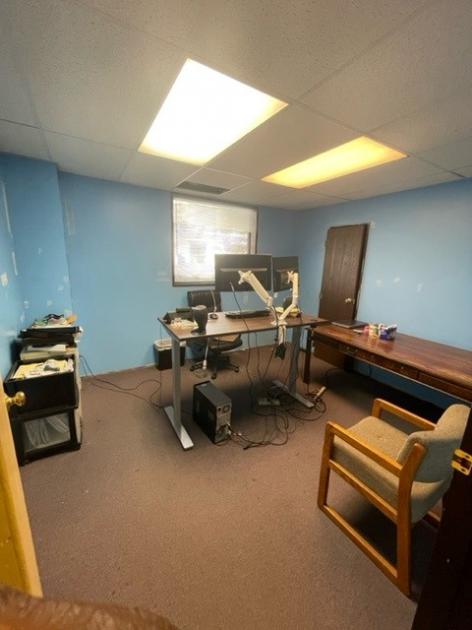
Additional Photos


Listing Agents

Mike Doss
M: 614-915-2624
mdoss@rweiler.com
M: 614-915-2624
mdoss@rweiler.com
While we strive to provide the most accurate information, all listing information, and demographic data, is provided by third-parties. As such, MyEListing will not be responsible for the accuracy of the information. It is strongly recommended that you verify all information with the listing agent, and any relevant agencies, prior to making any decisions.