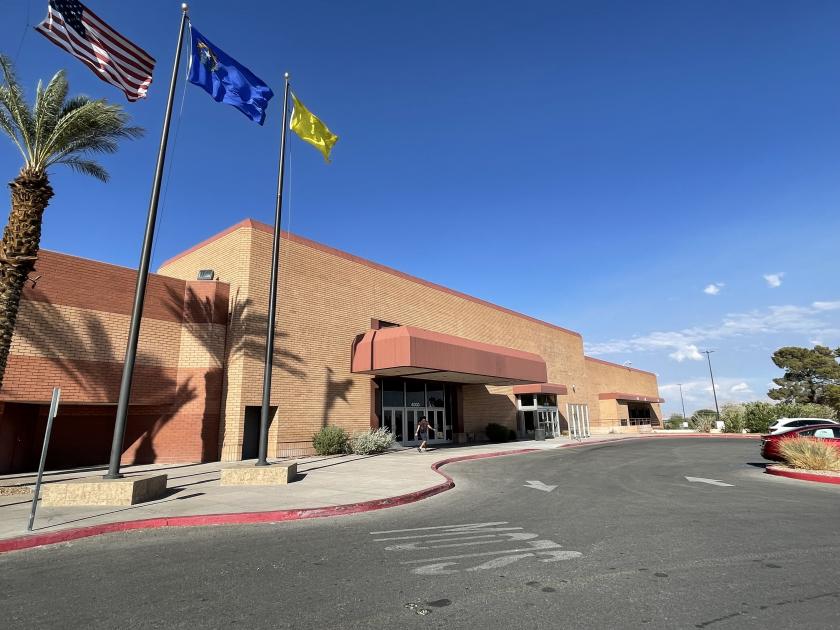
Retail Space
4000 Meadows Lane Las Vegas, NV 89107
4000 Meadows Lane Las Vegas, NV 89107
Details & Description
Property Highlights
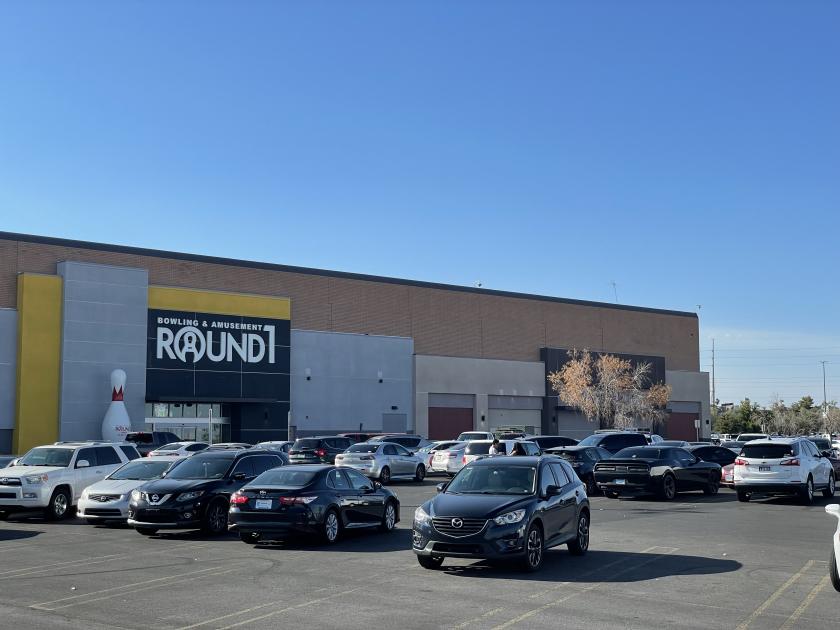
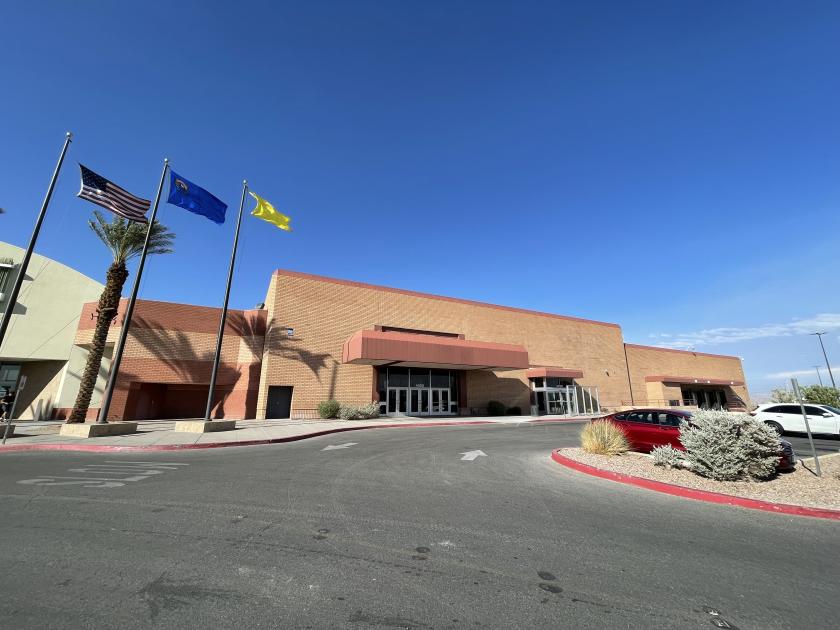
- • Anchor Space attached to Meadows Mall
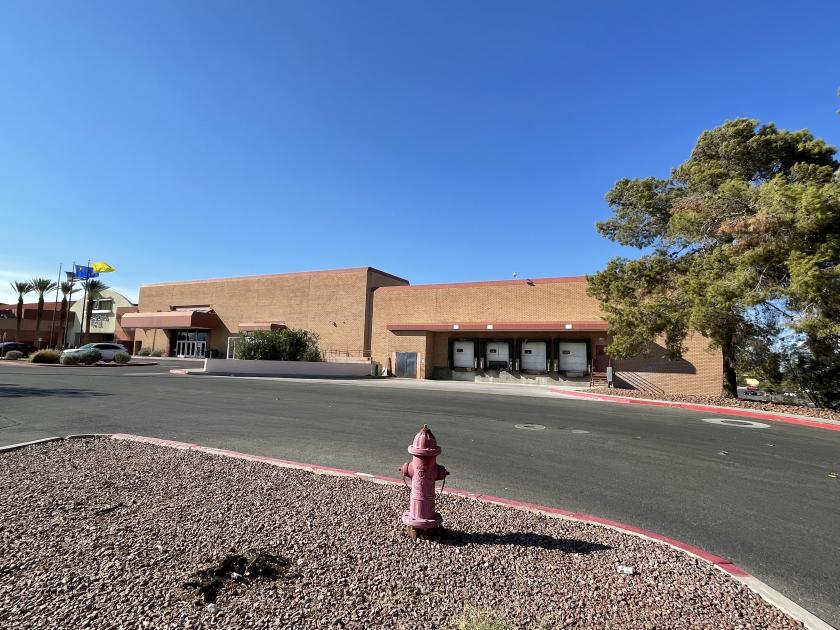
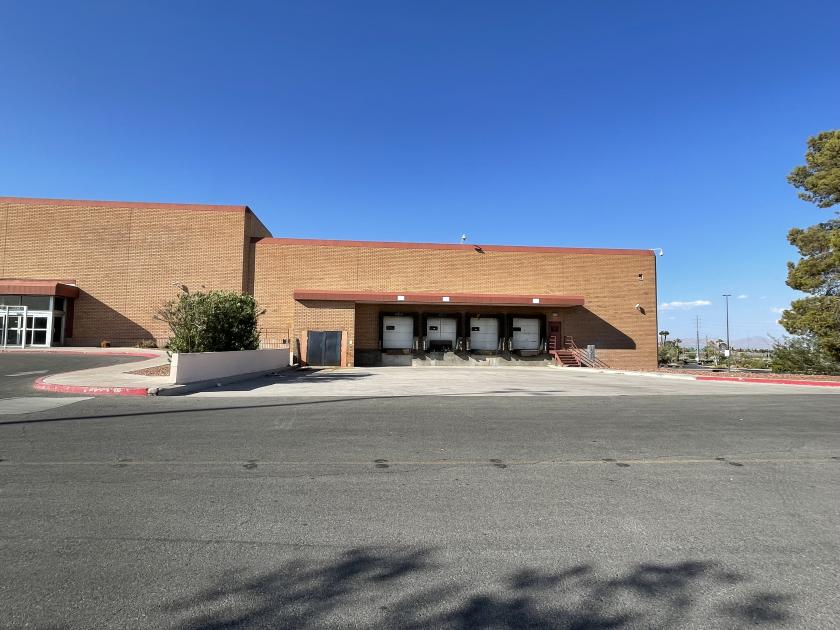
- • Building can be expanded by 30,000 SF
- • Meadows Mall draws 4.19 million visitors per year
- • Great visibility along US 95
- • Approximately 711 parking spaces 4.9 per 1,000
Additional Photos

Listing Agents

Chris Waldburger
O: 619-917-1576
chris@roicre.com
O: 619-917-1576
chris@roicre.com
While we strive to provide the most accurate information, all listing information, and demographic data, is provided by third-parties. As such, MyEListing will not be responsible for the accuracy of the information. It is strongly recommended that you verify all information with the listing agent, and any relevant agencies, prior to making any decisions.