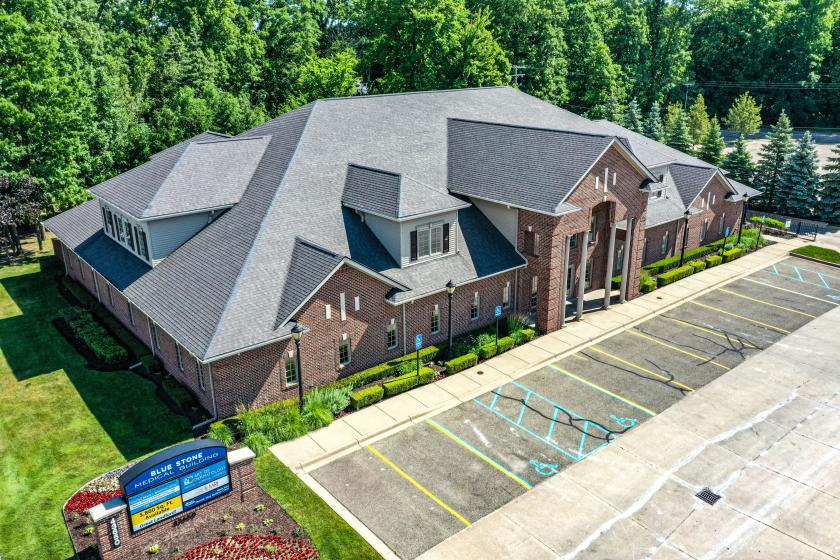
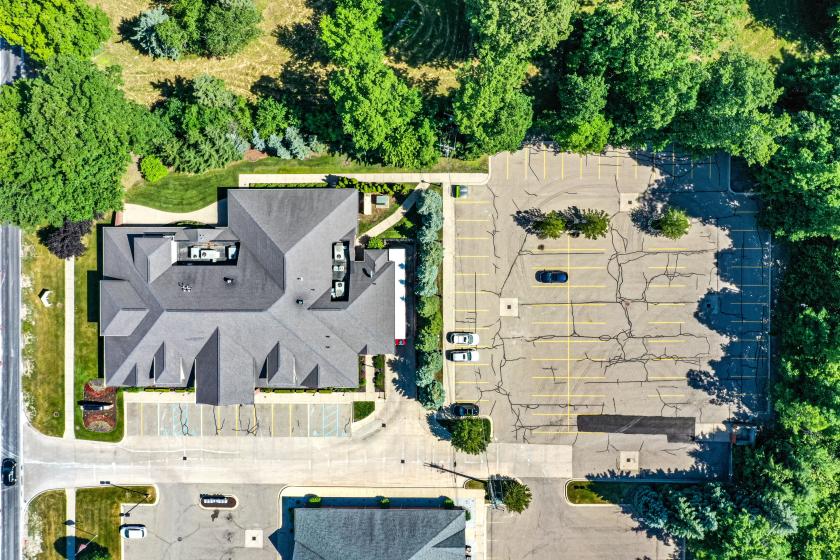
Office Space
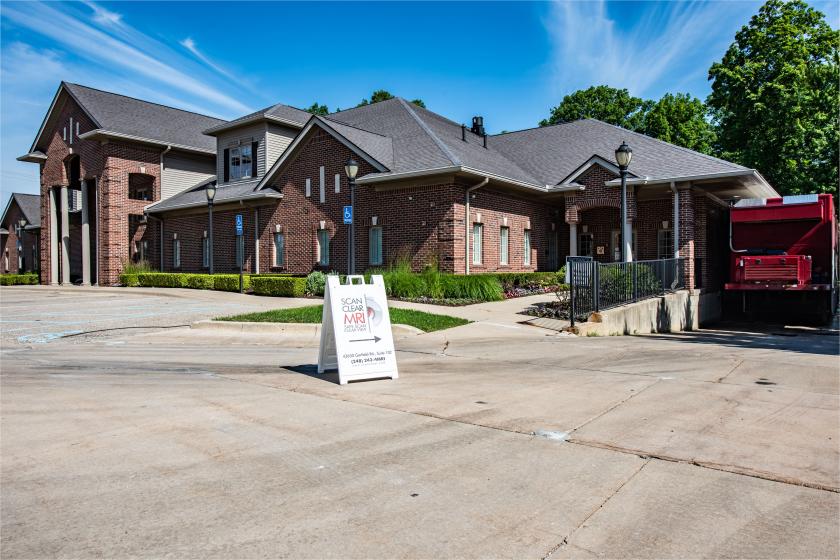
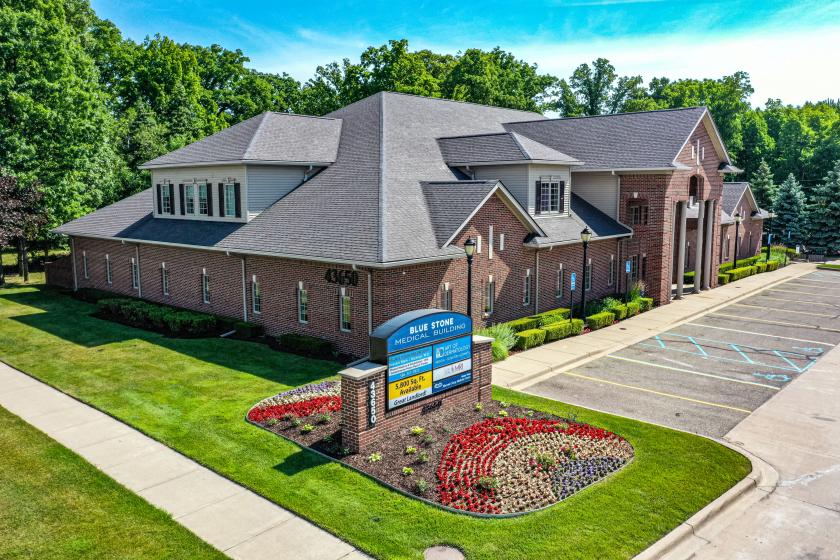
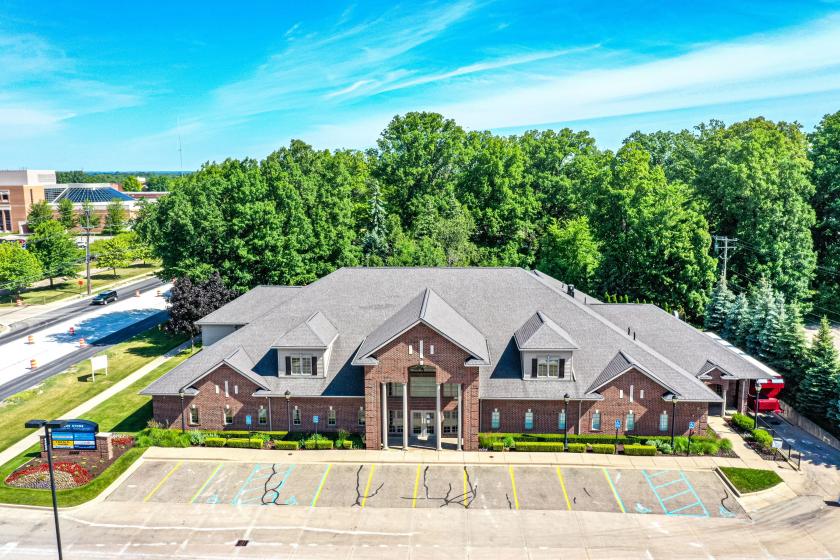
43650 Garfield Road Clinton Township, MI 48038
43650 Garfield Road Clinton Township, MI 48038
Details & Description
Property Highlights
- • Up to 13 Exam Office Rooms - Can be Divided
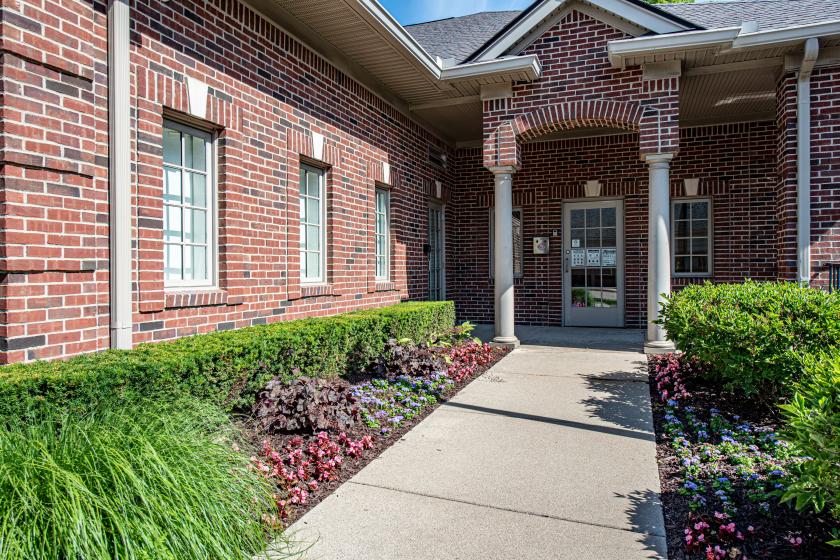
- • Large Waiting Room With Private Reception Desk
- • Private Kitchen, Employee Entrance, Restroom
- • High Visibility Monument Signage on Garfield Rd
Additional Photos

Listing Agents

Joshua Zeid
O: 248-496-0768
jzeid@sbre1.com
O: 248-496-0768
jzeid@sbre1.com
While we strive to provide the most accurate information, all listing information, and demographic data, is provided by third-parties. As such, MyEListing will not be responsible for the accuracy of the information. It is strongly recommended that you verify all information with the listing agent, and any relevant agencies, prior to making any decisions.