Commercial Land
16026 West Park Street, 16026 W PARK ST MUSSEY MI 4801 Capac, MI 48014
16026 West Park Street, 16026 W PARK ST MUSSEY MI 4801 Capac, MI 48014
Details & Description
Property Highlights
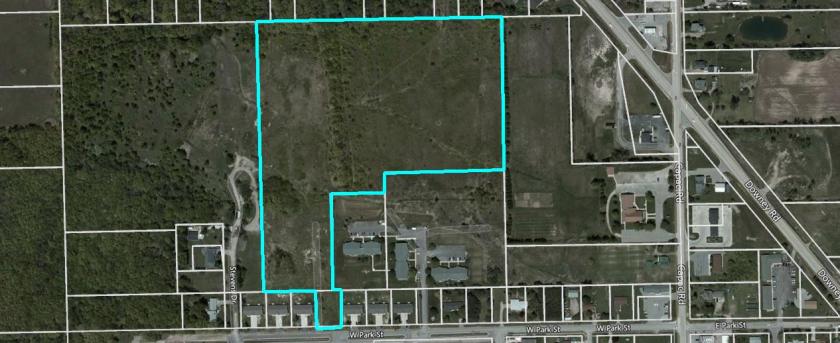
• Access through a vacant lot located at 16026 W Park. There is also a possible egress to Imlay CityDowney Road
• Located directly across from Capac Elementary and High School
Listing Agents

Charles Howard
O: 248-440-1447
charles.howard@transwestern.com
O: 248-440-1447
charles.howard@transwestern.com
While we strive to provide the most accurate information, all listing information, and demographic data, is provided by third-parties. As such, MyEListing will not be responsible for the accuracy of the information. It is strongly recommended that you verify all information with the listing agent, and any relevant agencies, prior to making any decisions.