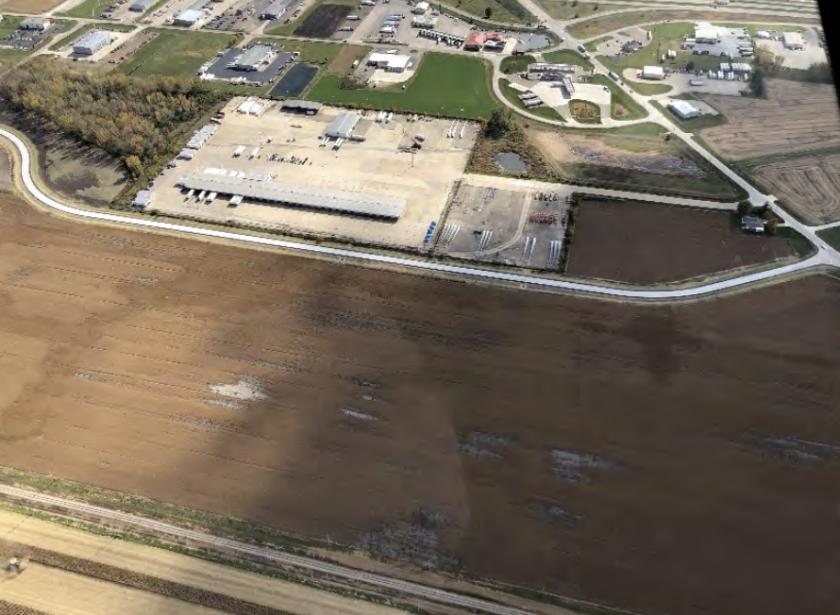
1-Mile | 3-Miles | 5-Miles | ||
---|---|---|---|---|
Total Population | 3,119 | 19,716 | 28,533 | |
Population Median Age | 44 | 41 | 41 | |
Population by Age | 0-9 Yrs | 424 (13%) | 2454 (12%) | 3445 (12%) |
10-19 Yrs | 359 (11%) | 2424 (12%) | 3472 (12%) | |
20-29 Yrs | 215 (6%) | 2251 (11%) | 3389 (11%) | |
30-39 Yrs | 327 (10%) | 2427 (12%) | 3479 (12%) | |
40-49 Yrs | 323 (10%) | 2111 (10%) | 3102 (10%) | |
50-59 Yrs | 568 (18%) | 2991 (15%) | 4264 (14%) | |
60-69 Yrs | 233 (7%) | 1891 (9%) | 2928 (10%) | |
70+ Yrs | 670 (21%) | 3166 (16%) | 4453 (15%) | |
Median HH Income | $61,469 | $51,095 | $52,094 | |
Total Household Income | < 24K | 278 (21%) | 1962 (23%) | 2780 (23%) |
25-49K | 272 (21%) | 2112 (25%) | 3037 (25%) | |
50-74K | 213 (16%) | 1691 (20%) | 2374 (19%) | |
75-99K | 233 (18%) | 975 (11%) | 1433 (11%) | |
100-199K | 232 (17%) | 1310 (15%) | 2003 (16%) | |
200K+ | 64 (4%) | 246 (2%) | 412 (3%) | |
Highest Education Level | No Diploma | 131 | 1552 | 2212 |
Diploma or GED | 667 | 4496 | 6595 | |
Some College | 604 | 3319 | 4835 | |
Assoc. Degree | 372 | 1549 | 2269 | |
Bachelors Degree | 337 | 2000 | 2760 | |
Higher Degree | 136 | 808 | 1261 | |
Total Housing Units | 1,385 | 9,306 | 13,381 | |
--Owner-Occupied | 993 | 5,439 | 8,111 | |
--Renter-Occupied | 299 | 2,856 | 3,929 | |
Owner-Occupied Values | < 100K | 247 | 2333 | 3458 |
100-199K | 546 | 2293 | 3312 | |
200-299K | 121 | 435 | 826 | |
300-399K | 55 | 229 | 315 | |
400-499K | 10 | 80 | 113 | |
500K+ | 14 | 69 | 86 | |
Total Working Age Population | 2,516 | 15,810 | 22,985 | |
In Work Force | 1,532 | 9,920 | 14,393 | |
Not In Work Force | 985 | 5,889 | 8,592 | |
Workforce Employed | 1,477 | 9,375 | 13,672 | |
Workforce Unemployed | 54 | 544 | 716 | |
Civlian Workforce | 1,532 | 9,919 | 14,388 | |
Military Workforce | 0 | 2 | 5 | |
Total Households | 1,292 | 8,295 | 12,039 | |
Family Households | 766 | 4,861 | 7,241 | |
Non-Family Households | 526 | 3,434 | 4,798 | |
Married Couple | 623 | 3,462 | 5,262 | |
Other Family | 143 | 1,399 | 1,979 | |
Married w/Child | 245 | 1,217 | 1,774 | |
Single Male w/Child | 12 | 178 | 266 | |
Single Female w/Child | 65 | 639 | 956 |
Population Change Last Two Decades - Plus Projection
2000 | % | 2010 | % | 2020 | % | 2030 | |
---|---|---|---|---|---|---|---|
Illinois | 12,419,293 | +3 | 12,830,632 | +12 | 14,316,487 | +6 | 15,138,849 |
Bureau County | 35,503 | -1 | 34,978 | +10 | 38,631 | +6 | 40,820 |
LaSalle County | 111,509 | +2 | 113,924 | +15 | 131,155 | +8 | 141,615 |
Putnam County | 6,086 | -1 | 6,006 | +9 | 6,526 | +4 | 6,758 |
Total Working Age Population:
Total Households:
Total Working Age Population:
Total Households:
Total Working Age Population:
Total Households: