Office Space
951 Yamato Road Boca Raton, FL 33487
951 Yamato Road Boca Raton, FL 33487
Details & Description
Property Highlights
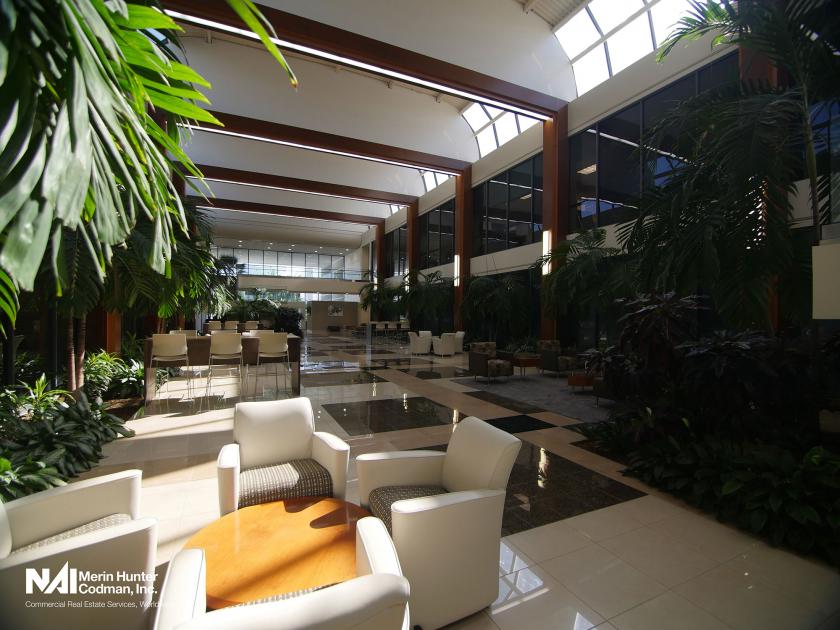
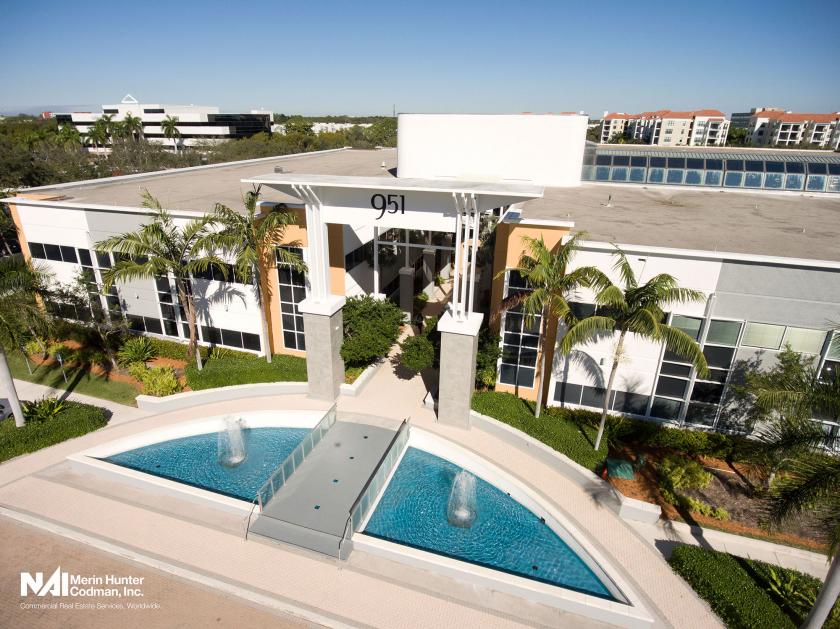
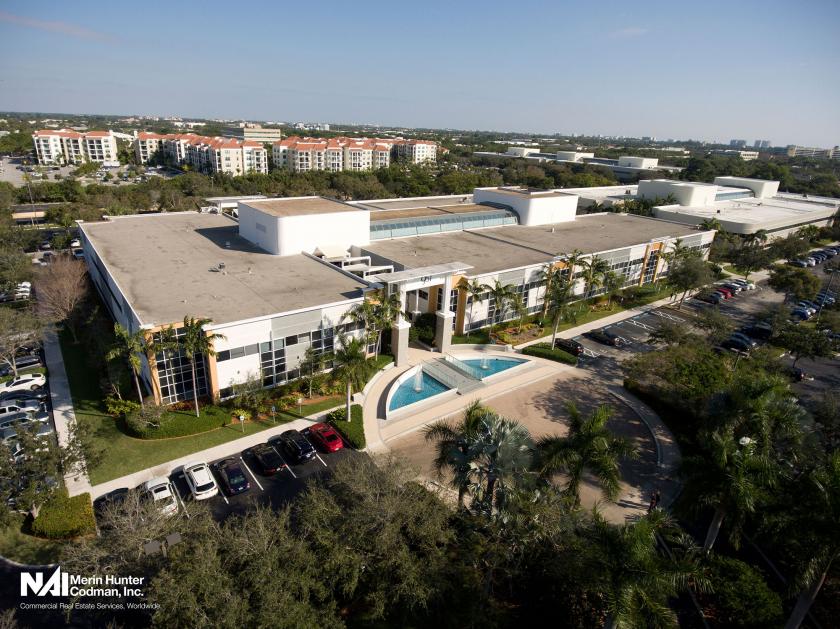
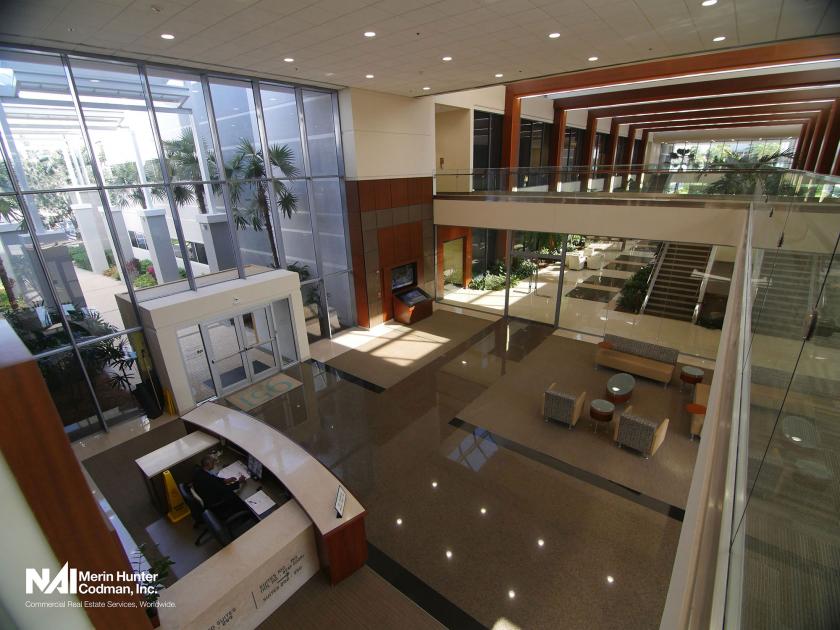
• Completely renovated high-end, two-story office building accented by on-site concierge, fiber optics, and ample surface
• Energy Star certified building with contemporary aesthetics and exceptional amenities along with custom and move-in rea
Additional Photos


Listing Agents

Jay Grossman
O: 561-394-5200
jgrossman@mhcreal.com
O: 561-394-5200
jgrossman@mhcreal.com
While we strive to provide the most accurate information, all listing information, and demographic data, is provided by third-parties. As such, MyEListing will not be responsible for the accuracy of the information. It is strongly recommended that you verify all information with the listing agent, and any relevant agencies, prior to making any decisions.