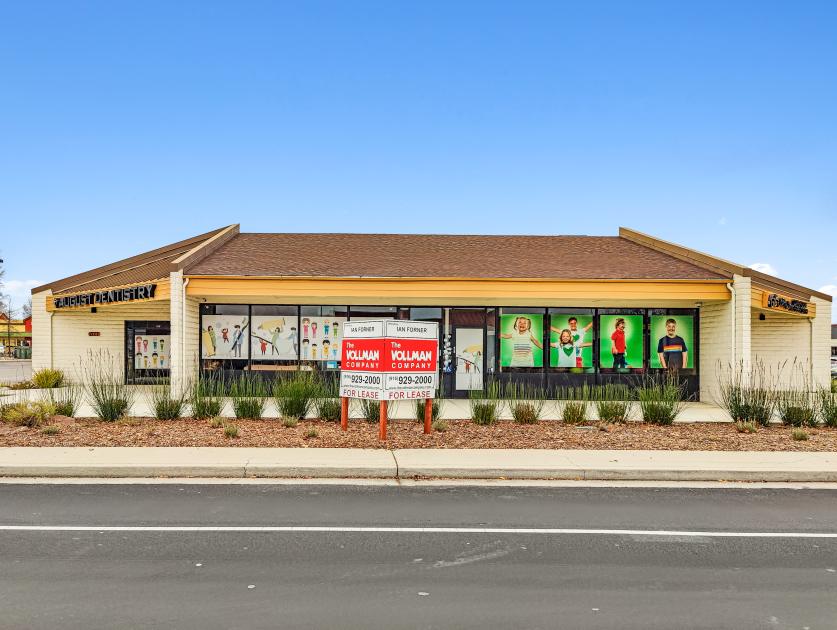
Excellent building and monument signage
Ample parking
Retail locations benefit trmendously from the high traffic of Douglas Blvd.
Suite 150 +/1,770 sf - $1.30/sf + NNN
Suite 160 +/-805 sf - $1.60/sf + NNN
Combined +/-2,575 sf - $1.40/sf + NNN
NNN estimated at $0.56/SF
Located in Douglas Plaza, one of Roseville's most prominent shopping centers, and positioned along Douglas Blvd., Roseville's main retail corridor, Douglas Blvd. is the main traffic thoroughfare from Interstate 80 to Roseville and Granite Bay, providing excellent exposure for any business.
Douglas Plaza is strategically located to attract customers from the surrounding communities of East Roseville and Granite Bay, which have some of the highest household incomes of any submarket in the greater Sacramento area.
Douglas Plaza offers a variety of dining options and professional amenities for your day to day business needs.
The population along Douglas Blvd. increases significantly during the day, benefiting all retail locations along this stretch of road.
The property has Convenient Access to Interstate 80 and Major Transportation Arteries linking the commercial, industrial, office, and surrounding residential neighborhoods.
No part of this information may be copied, reproduced, repurposed, or screen-captured for any commercial purpose without prior written authorization from MyEListing.
While we strive to provide the most accurate information, all listing information, and demographic data, is provided by third-parties. As such, MyEListing will not be responsible for the accuracy of the information. It is strongly recommended that you verify all information with the listing agent, and any relevant agencies, prior to making any decisions.
What is the asking price for 1701 Santa Clara Drive in Roseville?
The asking price for 1701 Santa Clara Drive is $15.60 - $19.20 a SF per Year
What is the building size of this commercial Retail property?
The size of this multi-unit property varies between 805 - 2575 square feet
What kind of Retail is the propery at 1701 Santa Clara Drive?
The property at 1701 Santa Clara Drive Roseville, CA 95661 is listed as a Shopping Center Retail property
What is the population within 1 mile of 1701 Santa Clara Drive in Roseville?
The population within 1 mile of 1701 Santa Clara Drive Roseville, CA 95661 is 10,643 people.
Who do I contact for questions about 1701 Santa Clara Drive?
You should contact the listing agent,
Joanna Monson, for any details regarding this commercial listing.