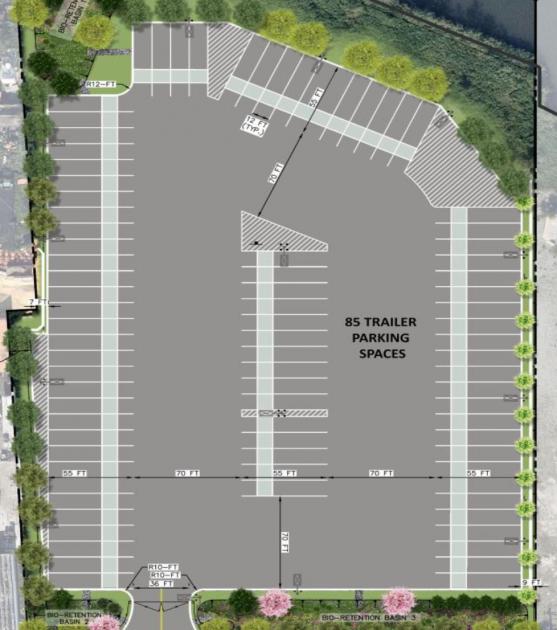
1-Mile | 3-Miles | 5-Miles | ||
---|---|---|---|---|
Total Population | 32,386 | 391,744 | 1,174,076 | |
Population Median Age | 37 | 35 | 38 | |
Population by Age | 0-9 Yrs | 4126 (12%) | 49844 (12%) | 123752 (10%) |
10-19 Yrs | 3052 (9%) | 31751 (8%) | 95637 (8%) | |
20-29 Yrs | 5675 (17%) | 73946 (18%) | 214042 (18%) | |
30-39 Yrs | 6633 (20%) | 93541 (23%) | 255015 (21%) | |
40-49 Yrs | 3887 (12%) | 50425 (12%) | 159059 (13%) | |
50-59 Yrs | 3281 (10%) | 39059 (9%) | 131207 (11%) | |
60-69 Yrs | 3301 (10%) | 29617 (7%) | 103651 (8%) | |
70+ Yrs | 2433 (7%) | 23561 (6%) | 91713 (7%) | |
Median HH Income | $58,883 | $90,108 | $93,906 | |
Total Household Income | < 24K | 3172 (25%) | 28902 (18%) | 89089 (17%) |
25-49K | 2340 (18%) | 22301 (13%) | 70200 (13%) | |
50-74K | 1802 (14%) | 19042 (11%) | 59411 (11%) | |
75-99K | 1754 (14%) | 16216 (10%) | 49635 (9%) | |
100-199K | 2440 (19%) | 41847 (26%) | 129013 (25%) | |
200K+ | 822 (6%) | 31784 (19%) | 115131 (22%) | |
Highest Education Level | No Diploma | 3331 | 32701 | 109331 |
Diploma or GED | 4710 | 54107 | 152032 | |
Some College | 2977 | 29689 | 85540 | |
Assoc. Degree | 817 | 10257 | 31672 | |
Bachelors Degree | 6936 | 90361 | 283279 | |
Higher Degree | 4067 | 68565 | 216825 | |
Total Housing Units | 13,366 | 176,443 | 576,329 | |
--Owner-Occupied | 2,779 | 45,150 | 142,738 | |
--Renter-Occupied | 9,552 | 114,943 | 369,740 | |
Owner-Occupied Values | < 100K | 76 | 1273 | 4970 |
100-199K | 333 | 2452 | 7367 | |
200-299K | 648 | 7091 | 17140 | |
300-399K | 667 | 8519 | 20799 | |
400-499K | 503 | 5551 | 14911 | |
500K+ | 551 | 20264 | 77552 | |
Total Working Age Population | 26,555 | 322,800 | 997,128 | |
In Work Force | 16,310 | 230,704 | 707,581 | |
Not In Work Force | 10,244 | 92,096 | 289,547 | |
Workforce Employed | 15,247 | 219,881 | 674,780 | |
Workforce Unemployed | 1,026 | 10,701 | 32,444 | |
Civlian Workforce | 16,273 | 230,582 | 707,223 | |
Military Workforce | 37 | 122 | 358 | |
Total Households | 12,330 | 160,092 | 512,479 | |
Family Households | 7,720 | 92,159 | 255,092 | |
Non-Family Households | 4,610 | 67,933 | 257,387 | |
Married Couple | 5,446 | 64,462 | 183,052 | |
Other Family | 2,274 | 27,697 | 72,040 | |
Married w/Child | 2,544 | 29,195 | 75,208 | |
Single Male w/Child | 226 | 2,689 | 7,784 | |
Single Female w/Child | 786 | 9,815 | 23,693 |
Population Change Last Two Decades - Plus Projection
2000 | % | 2010 | % | 2020 | % | 2030 | |
---|---|---|---|---|---|---|---|
New Jersey | 8,414,350 | +4 | 8,791,894 | +4 | 9,132,700 | +4 | 9,530,900 |
Bergen County | 884,118 | +2 | 905,116 | +7 | 967,500 | +7 | 1,031,500 |
Essex County | 793,633 | -1 | 783,969 | +3 | 808,300 | +3 | 829,800 |
Hudson County | 608,975 | +4 | 634,266 | +12 | 708,100 | +6 | 747,400 |
Union County | 522,541 | +3 | 536,499 | +7 | 573,000 | +6 | 605,600 |
New York | 18,976,457 | +2 | 19,378,102 | +4 | 20,146,131 | +2 | 20,604,030 |
Kings County | 2,465,326 | +2 | 2,504,700 | +9 | 2,738,283 | +5 | 2,863,996 |
New York County | 1,537,195 | +3 | 1,585,873 | +6 | 1,688,894 | +2 | 1,727,631 |
Queens County | 2,229,379 | 0 | 2,230,722 | +9 | 2,436,549 | +5 | 2,565,268 |
Total Working Age Population:
Total Households:
Total Working Age Population:
Total Households:
Total Working Age Population:
Total Households: