Office Space
5355 North Post Road Indianapolis, IN 46216
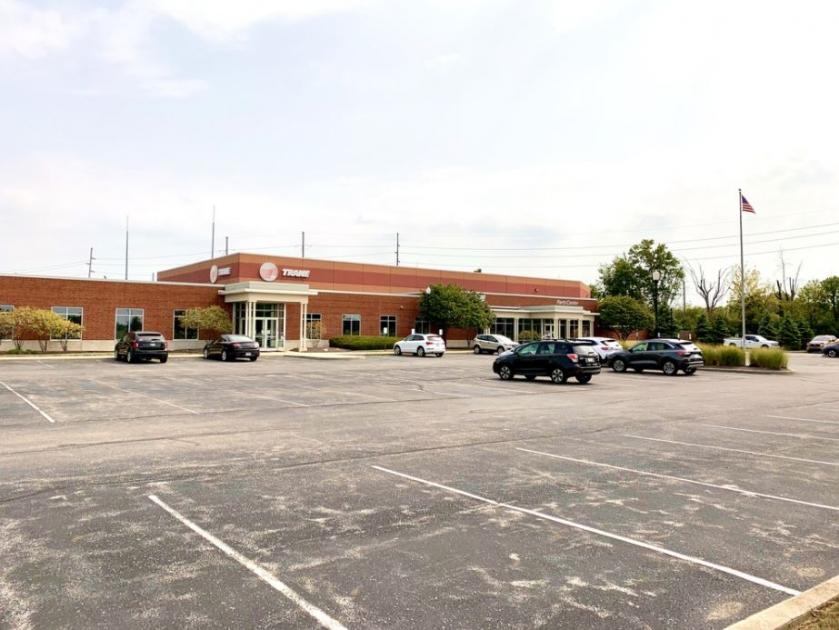
5355 North Post Road Indianapolis, IN 46216
Details & Description
Property Highlights
- • 34,910 SF with 18,139 SF of Office Space available
- • Excellent visibility from Post Road
- • Building Signage
- • High Quality Construction - BlockBrick
- • Zoning DP
- • 110 Parking spaces 3.671,000 SF
Additional Photos


Listing Agents

Bryan Augustin
O: 317-345-4897
bryana@alopg.com
O: 317-345-4897
bryana@alopg.com
While we strive to provide the most accurate information, all listing information, and demographic data, is provided by third-parties. As such, MyEListing will not be responsible for the accuracy of the information. It is strongly recommended that you verify all information with the listing agent, and any relevant agencies, prior to making any decisions.


