Industrial Properties
215 Industrial Drive Franklin, IN 46131
215 Industrial Drive Franklin, IN 46131

Details & Description
Property Highlights
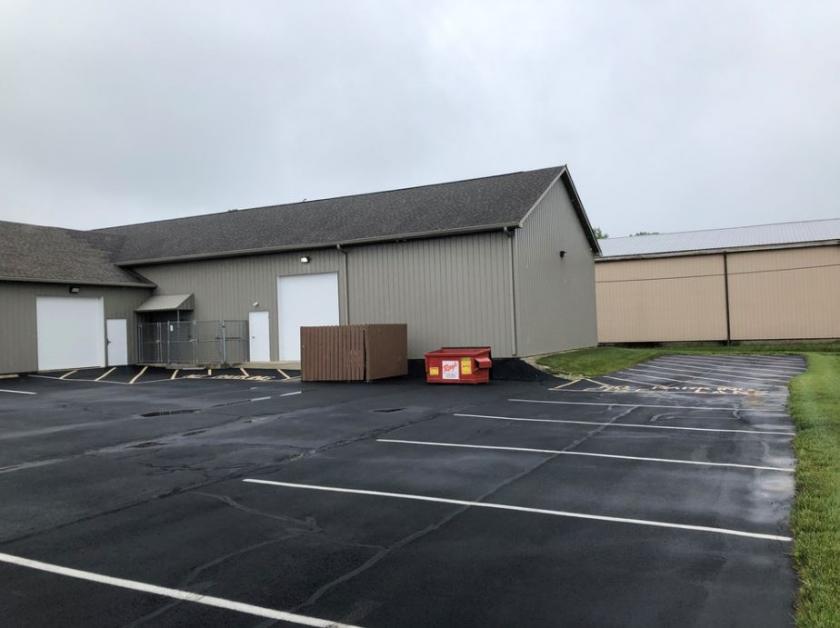
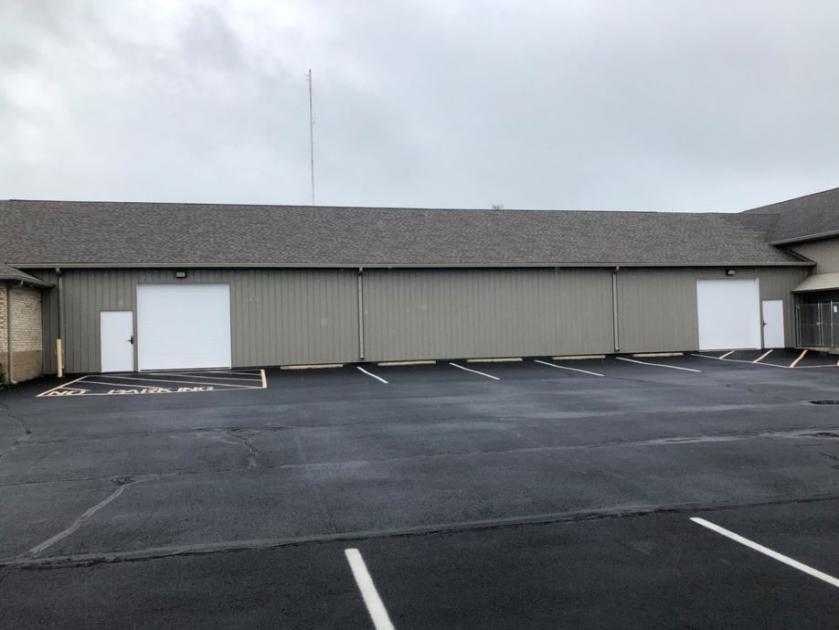
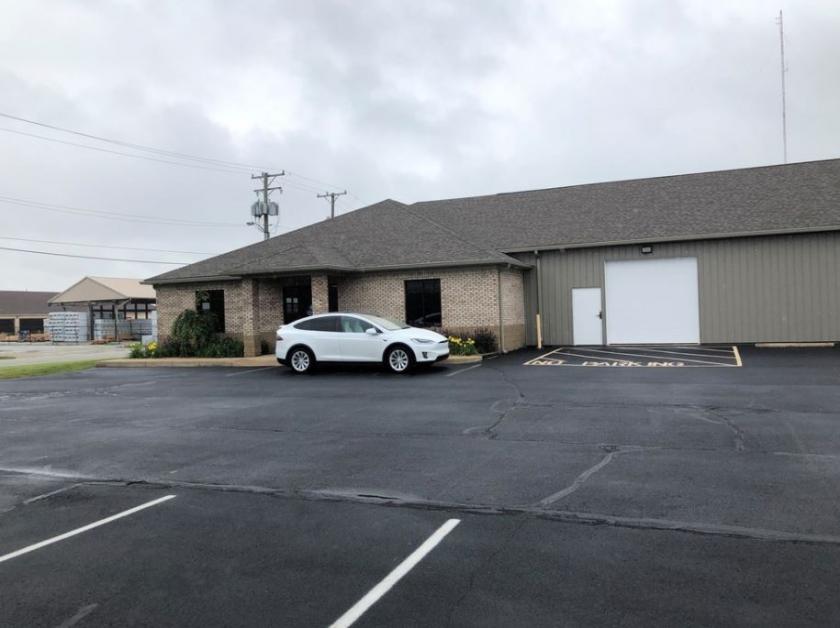
• Office Space 2,269 SF and Warehouse 8,100 SF. 600 SF is Mezzanine and not included in Square Footage
• Built in 2004. Expanded by 4,000 SF in 2014 and renovated in 2020
Additional Photos
Listing Agents

Bryan Augustin
O: 317-345-4897
bryana@alopg.com
O: 317-345-4897
bryana@alopg.com
While we strive to provide the most accurate information, all listing information, and demographic data, is provided by third-parties. As such, MyEListing will not be responsible for the accuracy of the information. It is strongly recommended that you verify all information with the listing agent, and any relevant agencies, prior to making any decisions.


