Office Space
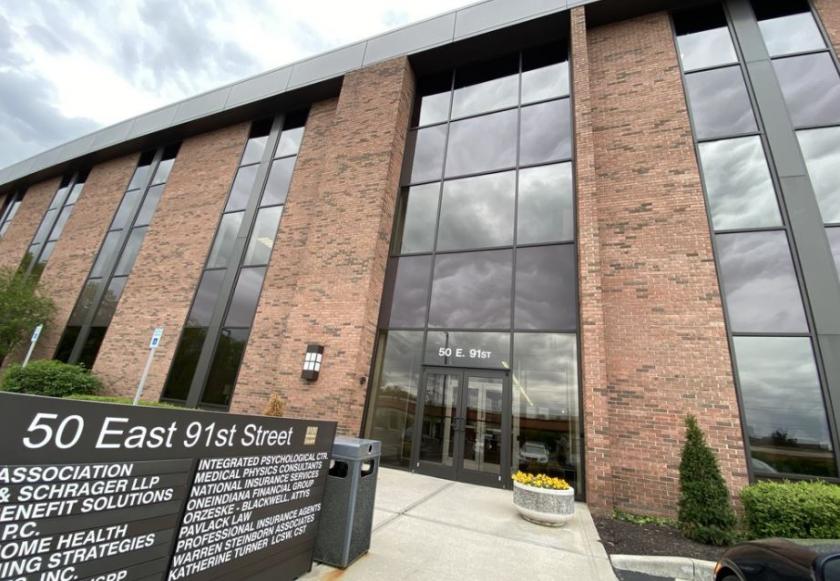
50 East 91st Street Indianapolis, IN 46240
50 East 91st Street Indianapolis, IN 46240
Details & Description
Property Highlights
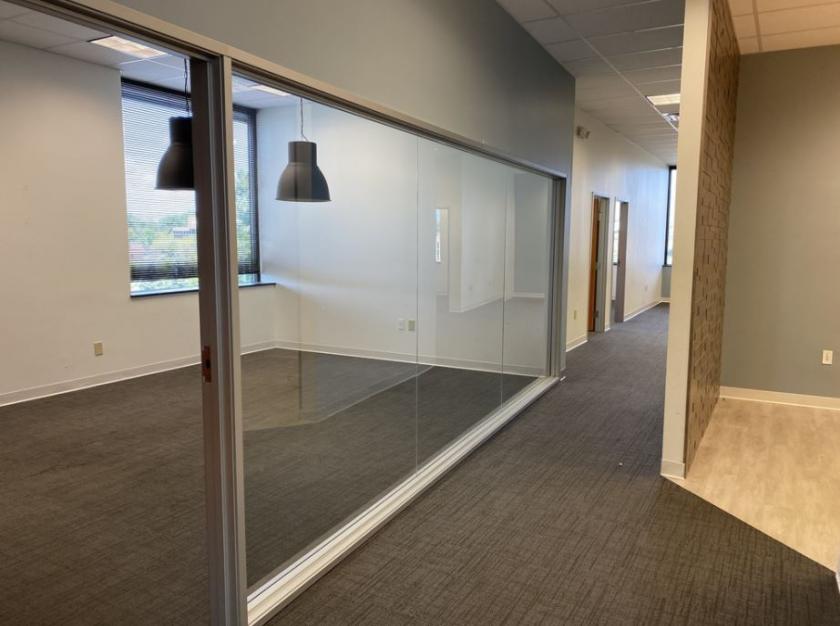
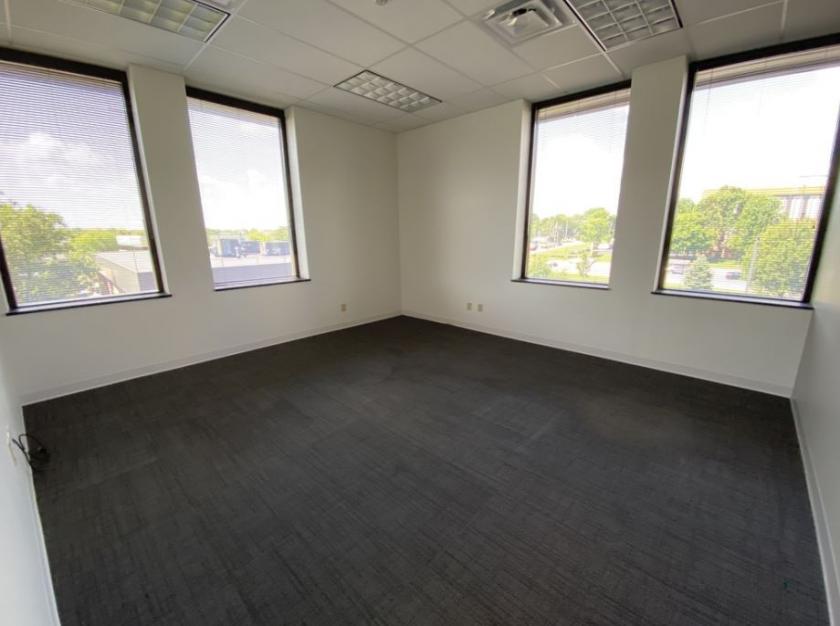
- • 3rd-floor corner suite, move-in ready
- • Sublease expiration March 30, 2023
- • Easy to find, quick access to US31 and 465
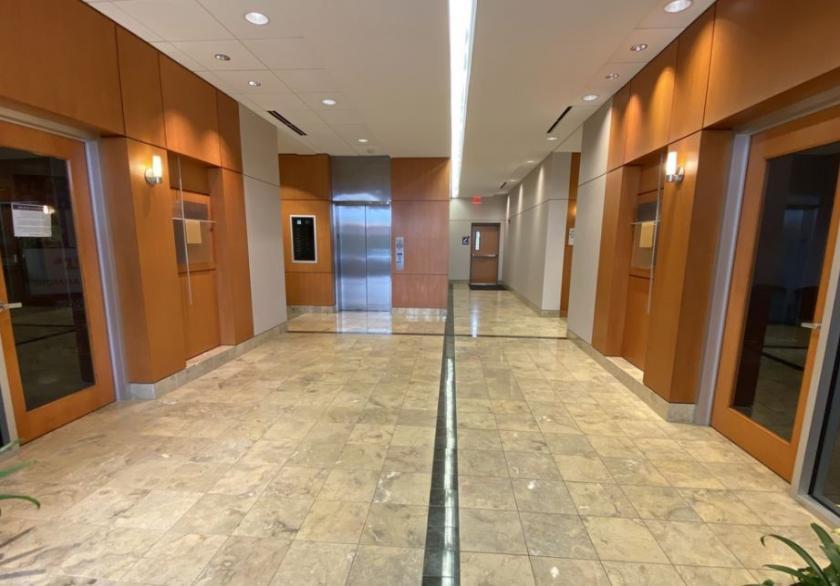
- • Recently renovated common areas
Additional Photos
Listing Agents

George Sechrist
O: 317-853-7000
M: 317-403-0903
george@alopg.com
O: 317-853-7000
M: 317-403-0903
george@alopg.com
While we strive to provide the most accurate information, all listing information, and demographic data, is provided by third-parties. As such, MyEListing will not be responsible for the accuracy of the information. It is strongly recommended that you verify all information with the listing agent, and any relevant agencies, prior to making any decisions.


