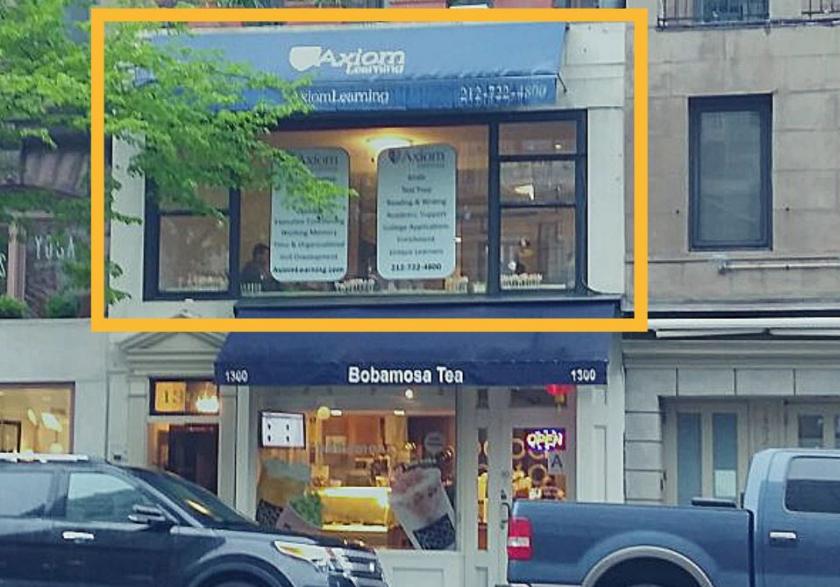
1-Mile | 3-Miles | 5-Miles | ||
---|---|---|---|---|
Total Population | 234,765 | 1,240,981 | 2,786,659 | |
Population Median Age | 42 | 40 | 39 | |
Population by Age | 0-9 Yrs | 22238 (9%) | 120605 (9%) | 285499 (10%) |
10-19 Yrs | 17431 (7%) | 95690 (7%) | 252257 (9%) | |
20-29 Yrs | 35840 (15%) | 216157 (17%) | 493114 (17%) | |
30-39 Yrs | 41692 (17%) | 239152 (19%) | 523024 (18%) | |
40-49 Yrs | 27808 (11%) | 158486 (12%) | 361198 (12%) | |
50-59 Yrs | 28107 (11%) | 148093 (11%) | 333003 (11%) | |
60-69 Yrs | 28746 (12%) | 125412 (10%) | 266786 (9%) | |
70+ Yrs | 32904 (14%) | 137385 (11%) | 271777 (9%) | |
Median HH Income | $98,353 | $86,674 | $73,973 | |
Total Household Income | < 24K | 20965 (18%) | 116897 (20%) | 266221 (22%) |
25-49K | 12408 (10%) | 76276 (13%) | 187063 (15%) | |
50-74K | 12990 (11%) | 67791 (11%) | 152110 (12%) | |
75-99K | 11710 (10%) | 56921 (9%) | 120910 (10%) | |
100-199K | 27345 (23%) | 136794 (23%) | 263358 (21%) | |
200K+ | 29188 (25%) | 120415 (20%) | 209189 (17%) | |
Highest Education Level | No Diploma | 14960 | 106316 | 317743 |
Diploma or GED | 19507 | 136306 | 378327 | |
Some College | 15087 | 94609 | 227599 | |
Assoc. Degree | 6364 | 39178 | 96635 | |
Bachelors Degree | 58671 | 290633 | 577872 | |
Higher Degree | 68963 | 280399 | 464617 | |
Total Housing Units | 133,088 | 676,369 | 1,363,446 | |
--Owner-Occupied | 34,342 | 147,001 | 292,177 | |
--Renter-Occupied | 80,266 | 428,093 | 906,673 | |
Owner-Occupied Values | < 100K | 1382 | 3697 | 11041 |
100-199K | 436 | 3519 | 12210 | |
200-299K | 623 | 5212 | 19297 | |
300-399K | 1011 | 8378 | 24834 | |
400-499K | 1754 | 10542 | 24068 | |
500K+ | 29135 | 115652 | 200729 | |
Total Working Age Population | 201,402 | 1,062,908 | 2,355,448 | |
In Work Force | 134,023 | 719,776 | 1,576,179 | |
Not In Work Force | 67,379 | 343,132 | 779,269 | |
Workforce Employed | 127,844 | 682,712 | 1,486,953 | |
Workforce Unemployed | 6,080 | 36,818 | 88,527 | |
Civlian Workforce | 133,925 | 719,530 | 1,575,479 | |
Military Workforce | 98 | 246 | 700 | |
Total Households | 114,607 | 575,094 | 1,198,850 | |
Family Households | 52,438 | 262,878 | 588,524 | |
Non-Family Households | 62,170 | 312,216 | 610,326 | |
Married Couple | 38,290 | 178,480 | 372,351 | |
Other Family | 14,148 | 84,398 | 216,173 | |
Married w/Child | 13,405 | 66,196 | 146,798 | |
Single Male w/Child | 1,094 | 6,257 | 17,879 | |
Single Female w/Child | 4,481 | 28,232 | 73,073 |
Population Change Last Two Decades - Plus Projection
2000 | % | 2010 | % | 2020 | % | 2030 | |
---|---|---|---|---|---|---|---|
New Jersey | 8,414,350 | +4 | 8,791,894 | +4 | 9,132,700 | +4 | 9,530,900 |
Bergen County | 884,118 | +2 | 905,116 | +7 | 967,500 | +7 | 1,031,500 |
Hudson County | 608,975 | +4 | 634,266 | +12 | 708,100 | +6 | 747,400 |
New York | 18,976,457 | +2 | 19,378,102 | +4 | 20,146,131 | +2 | 20,604,030 |
Bronx County | 1,332,650 | +4 | 1,385,108 | +10 | 1,519,809 | +6 | 1,604,168 |
Kings County | 2,465,326 | +2 | 2,504,700 | +9 | 2,738,283 | +5 | 2,863,996 |
New York County | 1,537,195 | +3 | 1,585,873 | +6 | 1,688,894 | +2 | 1,727,631 |
Queens County | 2,229,379 | 0 | 2,230,722 | +9 | 2,436,549 | +5 | 2,565,268 |
Total Working Age Population:
Total Households:
Total Working Age Population:
Total Households:
Total Working Age Population:
Total Households: