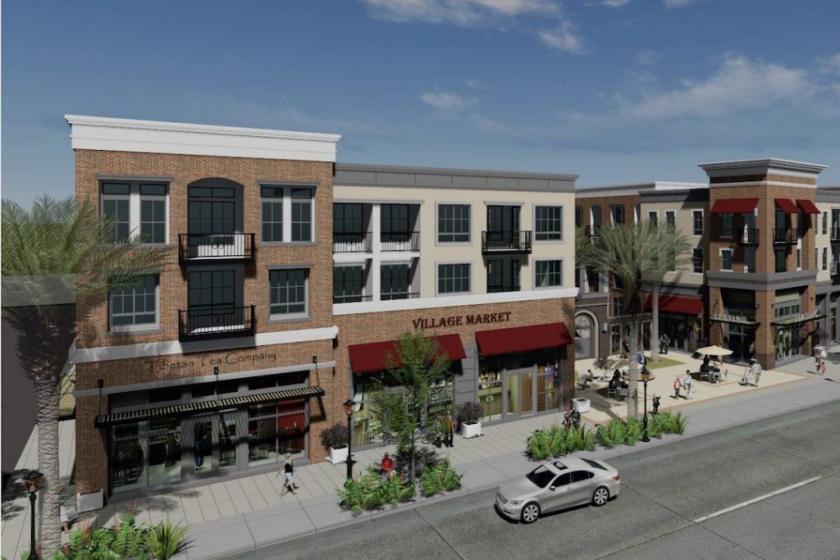
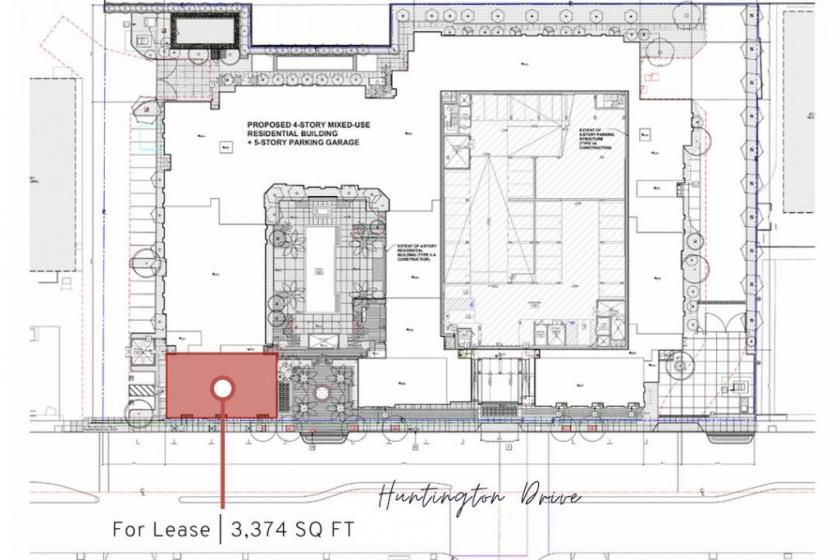
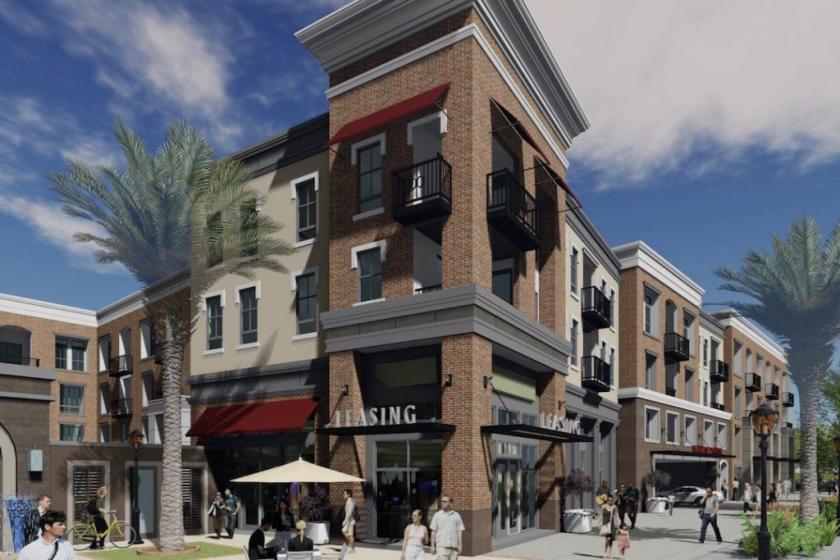
1-Mile | 3-Miles | 5-Miles | ||
---|---|---|---|---|
Total Population | 15,737 | 94,481 | 325,931 | |
Population Median Age | 42 | 40 | 39 | |
Population by Age | 0-9 Yrs | 1337 (8%) | 9794 (10%) | 36044 (11%) |
10-19 Yrs | 1914 (12%) | 11501 (12%) | 42881 (13%) | |
20-29 Yrs | 2334 (14%) | 12615 (13%) | 46825 (14%) | |
30-39 Yrs | 1966 (12%) | 12465 (13%) | 41886 (12%) | |
40-49 Yrs | 1978 (12%) | 13983 (14%) | 45803 (14%) | |
50-59 Yrs | 2055 (13%) | 13413 (14%) | 44133 (13%) | |
60-69 Yrs | 1819 (11%) | 11231 (11%) | 36191 (11%) | |
70+ Yrs | 2333 (14%) | 9478 (10%) | 32168 (9%) | |
Median HH Income | $59,682 | $79,343 | $74,964 | |
Total Household Income | < 24K | 1163 (22%) | 4329 (14%) | 13703 (14%) |
25-49K | 1121 (21%) | 5174 (17%) | 17775 (18%) | |
50-74K | 892 (16%) | 4697 (15%) | 16007 (16%) | |
75-99K | 693 (13%) | 4224 (14%) | 13589 (14%) | |
100-199K | 1137 (21%) | 8714 (29%) | 25629 (26%) | |
200K+ | 252 (4%) | 2730 (9%) | 8226 (8%) | |
Highest Education Level | No Diploma | 2081 | 10488 | 45374 |
Diploma or GED | 2547 | 14409 | 53597 | |
Some College | 2896 | 14411 | 43387 | |
Assoc. Degree | 1065 | 5693 | 17545 | |
Bachelors Degree | 1775 | 13786 | 42942 | |
Higher Degree | 1131 | 8280 | 21838 | |
Total Housing Units | 5,578 | 31,697 | 100,730 | |
--Owner-Occupied | 2,630 | 17,364 | 55,889 | |
--Renter-Occupied | 2,627 | 12,504 | 39,041 | |
Owner-Occupied Values | < 100K | 187 | 593 | 1998 |
100-199K | 2 | 213 | 800 | |
200-299K | 161 | 534 | 2215 | |
300-399K | 643 | 2039 | 8749 | |
400-499K | 717 | 3330 | 12003 | |
500K+ | 920 | 10656 | 30125 | |
Total Working Age Population | 13,161 | 77,764 | 264,219 | |
In Work Force | 7,818 | 50,510 | 167,591 | |
Not In Work Force | 5,343 | 27,254 | 96,628 | |
Workforce Employed | 7,320 | 47,457 | 158,588 | |
Workforce Unemployed | 498 | 3,053 | 8,927 | |
Civlian Workforce | 7,818 | 50,510 | 167,515 | |
Military Workforce | 0 | 0 | 75 | |
Total Households | 5,257 | 29,868 | 94,930 | |
Family Households | 3,448 | 21,745 | 73,425 | |
Non-Family Households | 1,809 | 8,123 | 21,505 | |
Married Couple | 2,292 | 15,020 | 50,884 | |
Other Family | 1,156 | 6,726 | 22,541 | |
Married w/Child | 851 | 6,088 | 21,573 | |
Single Male w/Child | 114 | 672 | 2,132 | |
Single Female w/Child | 267 | 1,254 | 5,189 |
Population Change Last Two Decades - Plus Projection
2000 | % | 2010 | % | 2020 | % | 2030 | |
---|---|---|---|---|---|---|---|
California | 33,871,648 | +10 | 37,253,956 | +9 | 40,467,295 | +8 | 43,631,295 |
Los Angeles County | 9,519,338 | +3 | 9,818,605 | +6 | 10,369,367 | +4 | 10,759,850 |
Total Working Age Population:
Total Households:
Total Working Age Population:
Total Households:
Total Working Age Population:
Total Households: