Retail Space
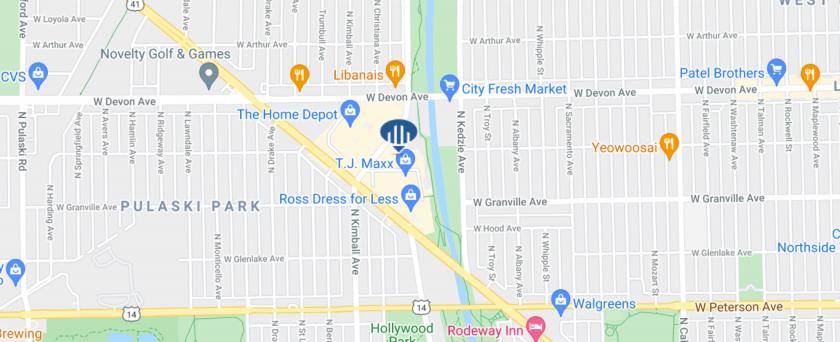
6257 North McCormick Boulevard, 6249-6257 Chicago, IL 60659
6257 North McCormick Boulevard, 6249-6257 Chicago, IL 60659
Details & Description
Property Highlights
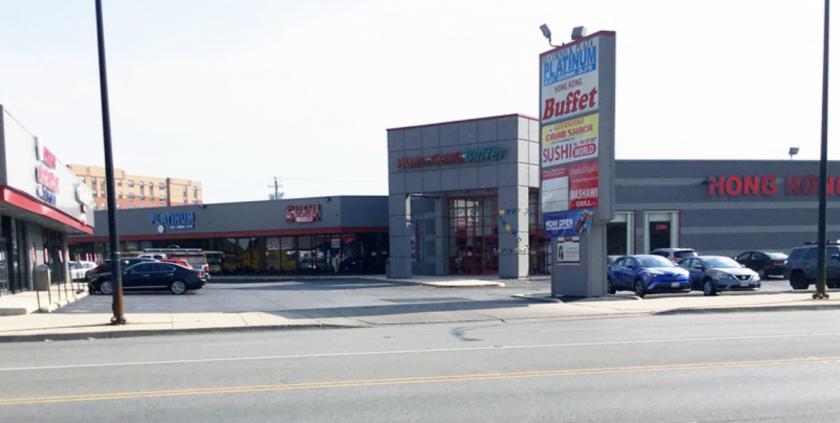
• McCormick Plaza is comprised of two-single story retail buildings totaling 30,560 SF on 2 acres 78,271 SF
• Two public transportation bus lines stop at the entrance
Listing Agents

Ed Barnett
TCN Worldwide RES
O: 773-714-2144
M: 312-560-3023
ebarnett@painewetzel.com
TCN Worldwide RES
O: 773-714-2144
M: 312-560-3023
ebarnett@painewetzel.com
While we strive to provide the most accurate information, all listing information, and demographic data, is provided by third-parties. As such, MyEListing will not be responsible for the accuracy of the information. It is strongly recommended that you verify all information with the listing agent, and any relevant agencies, prior to making any decisions.