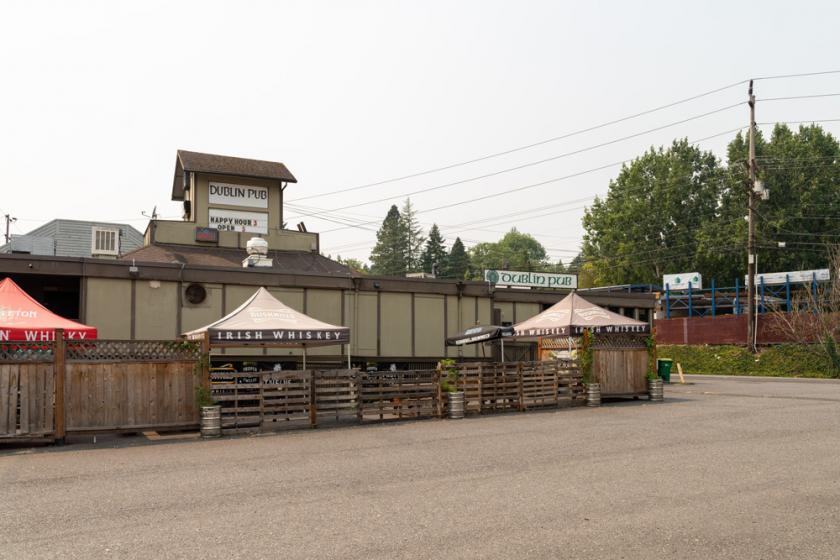
1-Mile | 3-Miles | 5-Miles | ||
---|---|---|---|---|
Total Population | 13,351 | 110,523 | 349,244 | |
Population Median Age | 43 | 41 | 40 | |
Population by Age | 0-9 Yrs | 1330 (9%) | 12883 (11%) | 34126 (9%) |
10-19 Yrs | 1412 (10%) | 10565 (9%) | 33725 (9%) | |
20-29 Yrs | 1397 (10%) | 13500 (12%) | 52754 (15%) | |
30-39 Yrs | 1788 (13%) | 17445 (15%) | 60337 (17%) | |
40-49 Yrs | 1948 (14%) | 15568 (14%) | 47687 (13%) | |
50-59 Yrs | 1495 (11%) | 14231 (12%) | 44409 (12%) | |
60-69 Yrs | 1812 (13%) | 14214 (12%) | 42642 (12%) | |
70+ Yrs | 2168 (16%) | 12118 (10%) | 33565 (9%) | |
Median HH Income | $84,965 | $85,130 | $79,337 | |
Total Household Income | < 24K | 863 (15%) | 6315 (13%) | 26272 (16%) |
25-49K | 967 (16%) | 8186 (17%) | 26688 (16%) | |
50-74K | 844 (14%) | 6458 (13%) | 22388 (14%) | |
75-99K | 483 (8%) | 5679 (12%) | 19081 (12%) | |
100-199K | 1445 (25%) | 12239 (26%) | 41676 (26%) | |
200K+ | 1131 (19%) | 7643 (16%) | 21214 (13%) | |
Highest Education Level | No Diploma | 287 | 4425 | 13337 |
Diploma or GED | 934 | 9564 | 30714 | |
Some College | 2072 | 14333 | 47421 | |
Assoc. Degree | 558 | 4857 | 17325 | |
Bachelors Degree | 3740 | 26675 | 88210 | |
Higher Degree | 2522 | 21387 | 63246 | |
Total Housing Units | 6,056 | 49,267 | 168,194 | |
--Owner-Occupied | 3,302 | 27,780 | 79,233 | |
--Renter-Occupied | 2,430 | 18,741 | 78,085 | |
Owner-Occupied Values | < 100K | 26 | 560 | 1273 |
100-199K | 26 | 856 | 3278 | |
200-299K | 112 | 2169 | 8194 | |
300-399K | 346 | 5065 | 16020 | |
400-499K | 481 | 5413 | 15933 | |
500K+ | 2311 | 13718 | 34535 | |
Total Working Age Population | 11,115 | 90,896 | 294,390 | |
In Work Force | 7,197 | 63,024 | 203,988 | |
Not In Work Force | 3,917 | 27,873 | 90,403 | |
Workforce Employed | 6,918 | 60,071 | 194,340 | |
Workforce Unemployed | 279 | 2,739 | 9,316 | |
Civlian Workforce | 7,197 | 62,810 | 203,657 | |
Military Workforce | 0 | 213 | 331 | |
Total Households | 5,732 | 46,521 | 157,318 | |
Family Households | 3,218 | 27,034 | 79,249 | |
Non-Family Households | 2,514 | 19,487 | 78,069 | |
Married Couple | 2,712 | 21,507 | 64,214 | |
Other Family | 506 | 5,528 | 15,035 | |
Married w/Child | 1,145 | 8,702 | 24,773 | |
Single Male w/Child | 67 | 755 | 2,123 | |
Single Female w/Child | 146 | 2,237 | 5,967 |
Population Change Last Two Decades - Plus Projection
2000 | % | 2010 | % | 2020 | % | 2030 | |
---|---|---|---|---|---|---|---|
Oregon | 3,421,399 | +12 | 3,831,074 | +11 | 4,264,810 | +11 | 4,727,438 |
Clackamas County | 338,391 | +11 | 375,992 | +14 | 428,860 | +14 | 490,011 |
Multnomah County | 660,486 | +11 | 735,334 | +12 | 822,675 | +10 | 906,904 |
Washington County | 445,342 | +19 | 529,710 | +17 | 619,337 | +16 | 718,633 |
Washington | 5,894,121 | +14 | 6,724,540 | +14 | 7,638,415 | +11 | 8,503,178 |
Clark County | 345,238 | +23 | 425,363 | +17 | 499,400 | +16 | 576,879 |
Total Working Age Population:
Total Households:
Total Working Age Population:
Total Households:
Total Working Age Population:
Total Households: