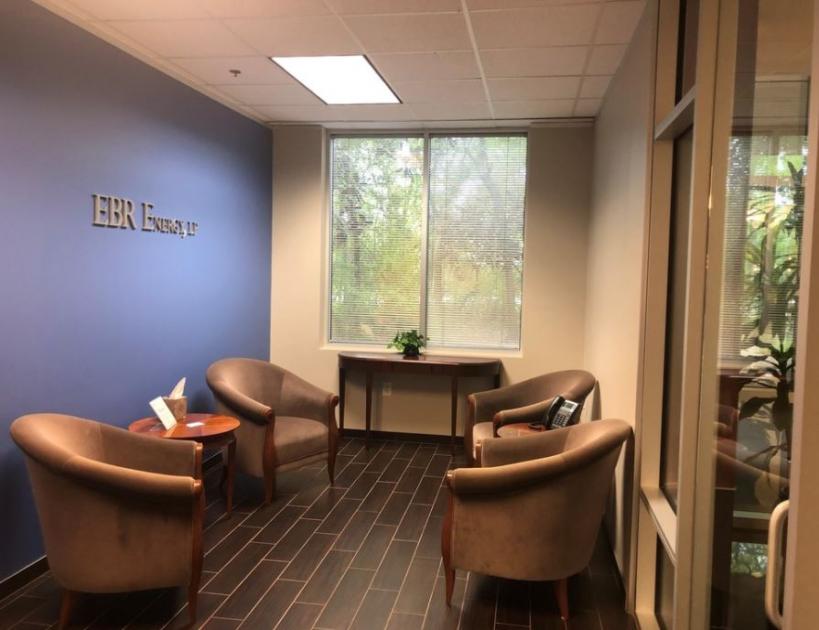
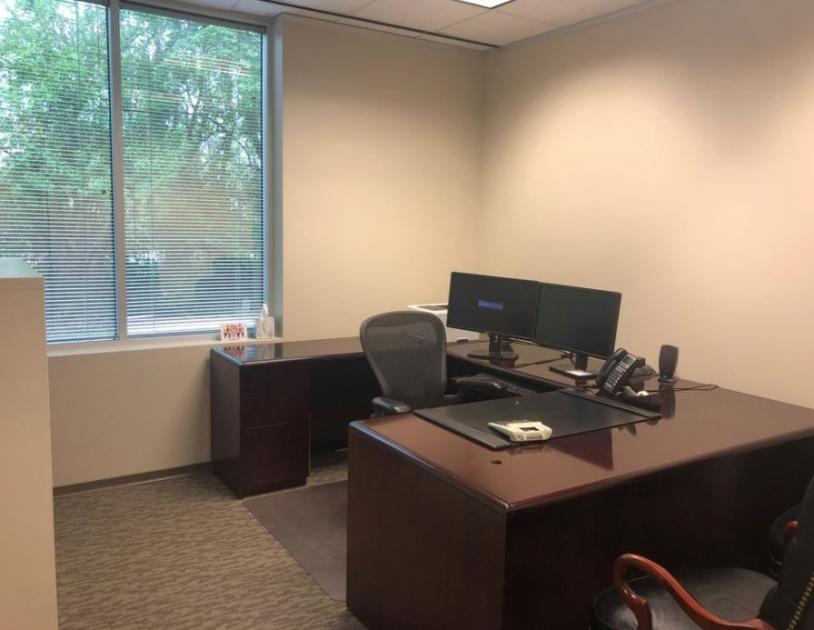
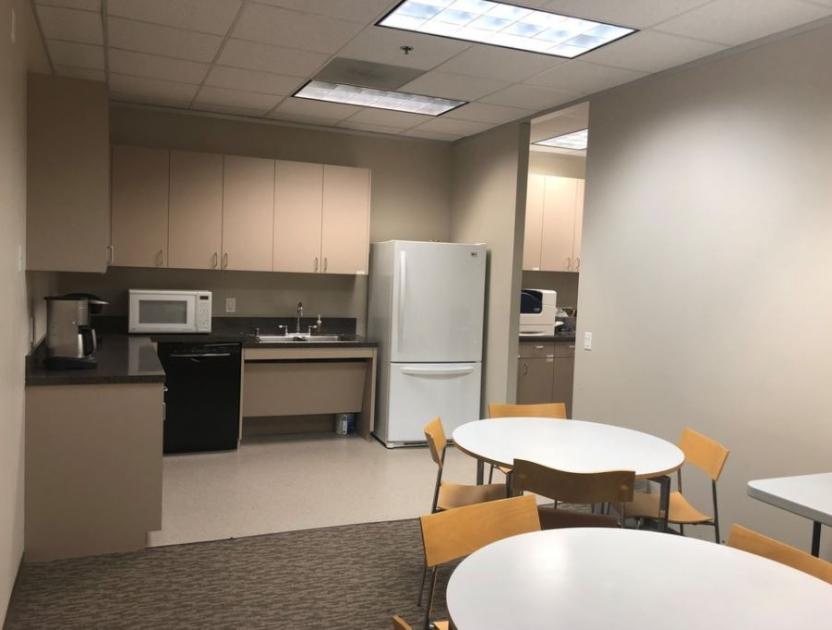
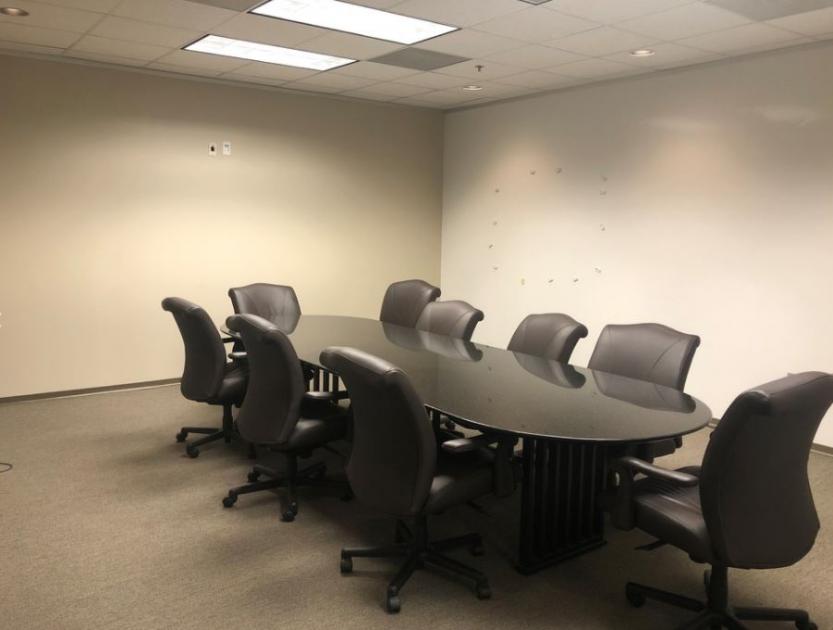
1-Mile | 3-Miles | 5-Miles | ||
---|---|---|---|---|
Total Population | 5,115 | 97,966 | 309,354 | |
Population Median Age | 48 | 40 | 37 | |
Population by Age | 0-9 Yrs | 389 (7%) | 10350 (10%) | 39619 (12%) |
10-19 Yrs | 405 (7%) | 11590 (11%) | 43017 (13%) | |
20-29 Yrs | 521 (10%) | 14044 (14%) | 45064 (14%) | |
30-39 Yrs | 500 (9%) | 12767 (13%) | 41090 (13%) | |
40-49 Yrs | 442 (8%) | 12642 (12%) | 40994 (13%) | |
50-59 Yrs | 777 (15%) | 13437 (13%) | 41060 (13%) | |
60-69 Yrs | 1172 (22%) | 13390 (13%) | 36515 (11%) | |
70+ Yrs | 909 (17%) | 9745 (9%) | 21993 (7%) | |
Median HH Income | $128,426 | $81,689 | $72,302 | |
Total Household Income | < 24K | 199 (10%) | 4353 (12%) | 14675 (14%) |
25-49K | 141 (7%) | 5763 (16%) | 20010 (19%) | |
50-74K | 177 (9%) | 6113 (17%) | 17402 (17%) | |
75-99K | 257 (13%) | 4730 (13%) | 12413 (12%) | |
100-199K | 623 (32%) | 9527 (27%) | 24432 (24%) | |
200K+ | 535 (27%) | 4503 (12%) | 11618 (11%) | |
Highest Education Level | No Diploma | 206 | 6222 | 28480 |
Diploma or GED | 441 | 11853 | 41566 | |
Some College | 726 | 12652 | 37833 | |
Assoc. Degree | 220 | 5090 | 13684 | |
Bachelors Degree | 1464 | 21512 | 51763 | |
Higher Degree | 975 | 12185 | 31807 | |
Total Housing Units | 2,042 | 37,060 | 106,363 | |
--Owner-Occupied | 1,771 | 22,204 | 63,351 | |
--Renter-Occupied | 161 | 12,785 | 37,199 | |
Owner-Occupied Values | < 100K | 27 | 1158 | 6325 |
100-199K | 149 | 6045 | 21952 | |
200-299K | 322 | 7237 | 15817 | |
300-399K | 478 | 4224 | 8730 | |
400-499K | 337 | 1577 | 4533 | |
500K+ | 458 | 1964 | 5994 | |
Total Working Age Population | 4,542 | 80,977 | 243,923 | |
In Work Force | 2,611 | 53,169 | 163,351 | |
Not In Work Force | 1,931 | 27,808 | 80,571 | |
Workforce Employed | 2,499 | 50,577 | 153,504 | |
Workforce Unemployed | 112 | 2,577 | 9,764 | |
Civlian Workforce | 2,611 | 53,154 | 163,268 | |
Military Workforce | 0 | 14 | 83 | |
Total Households | 1,932 | 34,989 | 100,550 | |
Family Households | 1,520 | 25,331 | 76,633 | |
Non-Family Households | 412 | 9,658 | 23,917 | |
Married Couple | 1,378 | 19,696 | 56,748 | |
Other Family | 142 | 5,634 | 19,884 | |
Married w/Child | 293 | 7,671 | 25,200 | |
Single Male w/Child | 2 | 366 | 1,792 | |
Single Female w/Child | 24 | 1,932 | 7,738 |
Population Change Last Two Decades - Plus Projection
2000 | % | 2010 | % | 2020 | % | 2030 | |
---|---|---|---|---|---|---|---|
Texas | 20,851,820 | +21 | 25,145,561 | +18 | 29,677,668 | +18 | 34,894,452 |
Brazoria County | 241,767 | +30 | 313,166 | +20 | 375,869 | +20 | 452,517 |
Fort Bend County | 354,452 | +65 | 585,375 | +44 | 840,383 | +43 | 1,203,029 |
Harris County | 3,400,578 | +20 | 4,092,459 | +22 | 4,978,845 | +19 | 5,924,750 |
Total Working Age Population:
Total Households:
Total Working Age Population:
Total Households:
Total Working Age Population:
Total Households: