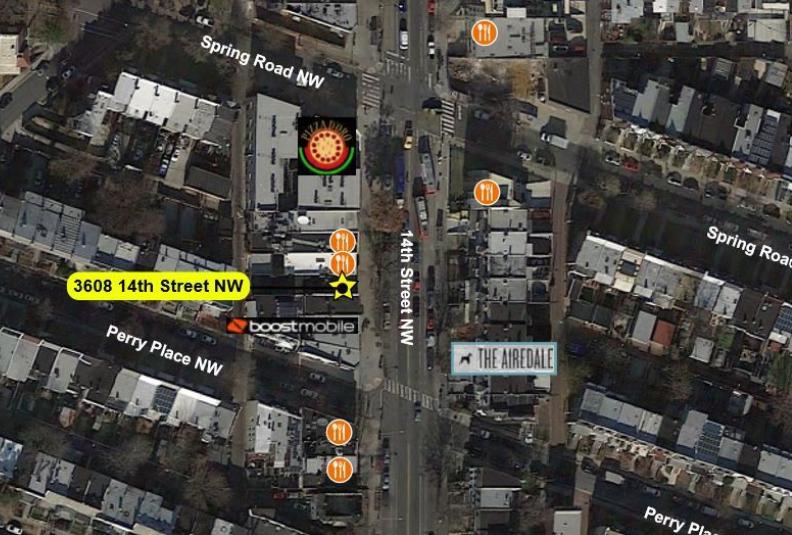
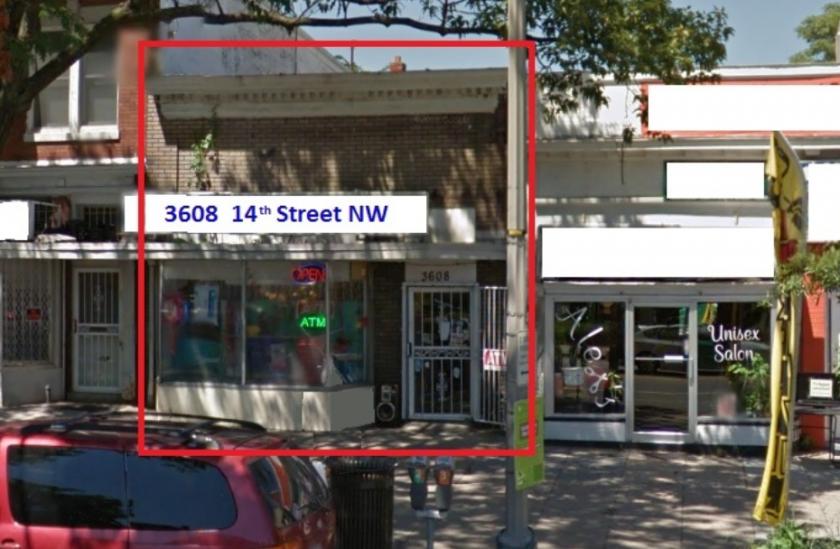
1-Mile | 3-Miles | 5-Miles | ||
---|---|---|---|---|
Total Population | 73,332 | 395,239 | 796,658 | |
Population Median Age | 36 | 37 | 37 | |
Population by Age | 0-9 Yrs | 7918 (10%) | 36438 (9%) | 85445 (10%) |
10-19 Yrs | 4559 (6%) | 31884 (8%) | 70847 (8%) | |
20-29 Yrs | 16211 (22%) | 86777 (21%) | 157683 (19%) | |
30-39 Yrs | 17988 (24%) | 85749 (21%) | 161770 (20%) | |
40-49 Yrs | 9374 (12%) | 47117 (11%) | 99813 (12%) | |
50-59 Yrs | 7520 (10%) | 40812 (10%) | 85238 (10%) | |
60-69 Yrs | 5285 (7%) | 33597 (8%) | 70374 (8%) | |
70+ Yrs | 4477 (6%) | 32866 (8%) | 65488 (8%) | |
Median HH Income | $93,961 | $102,575 | $101,797 | |
Total Household Income | < 24K | 4797 (16%) | 24551 (14%) | 43894 (13%) |
25-49K | 3448 (11%) | 19251 (11%) | 39661 (11%) | |
50-74K | 3735 (12%) | 20372 (12%) | 41431 (12%) | |
75-99K | 3285 (11%) | 18475 (10%) | 37891 (11%) | |
100-199K | 8461 (29%) | 50667 (29%) | 97188 (29%) | |
200K+ | 5217 (18%) | 35726 (21%) | 70588 (21%) | |
Highest Education Level | No Diploma | 8456 | 24896 | 58224 |
Diploma or GED | 7658 | 32721 | 68082 | |
Some College | 5627 | 28808 | 56475 | |
Assoc. Degree | 1218 | 6629 | 16421 | |
Bachelors Degree | 14607 | 82061 | 158010 | |
Higher Degree | 19194 | 118288 | 221816 | |
Total Housing Units | 31,399 | 186,277 | 360,648 | |
--Owner-Occupied | 11,194 | 71,911 | 143,680 | |
--Renter-Occupied | 17,750 | 97,131 | 186,974 | |
Owner-Occupied Values | < 100K | 145 | 1268 | 2251 |
100-199K | 85 | 894 | 3210 | |
200-299K | 465 | 4298 | 11250 | |
300-399K | 1278 | 8196 | 16846 | |
400-499K | 1398 | 9673 | 16478 | |
500K+ | 7823 | 47580 | 93645 | |
Total Working Age Population | 62,588 | 344,247 | 674,492 | |
In Work Force | 49,512 | 253,857 | 497,077 | |
Not In Work Force | 13,076 | 90,390 | 177,415 | |
Workforce Employed | 47,019 | 241,080 | 470,293 | |
Workforce Unemployed | 2,381 | 11,960 | 23,579 | |
Civlian Workforce | 49,400 | 253,040 | 493,872 | |
Military Workforce | 112 | 817 | 3,205 | |
Total Households | 28,944 | 169,041 | 330,654 | |
Family Households | 12,059 | 65,366 | 146,765 | |
Non-Family Households | 16,886 | 103,676 | 183,889 | |
Married Couple | 7,369 | 46,167 | 104,934 | |
Other Family | 4,690 | 19,198 | 41,831 | |
Married w/Child | 2,857 | 16,797 | 42,523 | |
Single Male w/Child | 589 | 1,946 | 5,751 | |
Single Female w/Child | 1,357 | 5,937 | 12,832 |
Population Change Last Two Decades - Plus Projection
2000 | % | 2010 | % | 2020 | % | 2030 | |
---|---|---|---|---|---|---|---|
District of Columbia | 572,059 | +5 | 601,723 | +21 | 729,501 | +15 | 842,154 |
Maryland | 5,296,486 | +9 | 5,773,552 | +6 | 6,141,900 | +6 | 6,518,750 |
Montgomery County | 873,341 | +11 | 971,777 | +8 | 1,052,050 | +7 | 1,128,800 |
Prince Georges County | 801,515 | +8 | 863,420 | +6 | 916,150 | +4 | 952,950 |
Virginia | 7,078,515 | +13 | 8,001,024 | +8 | 8,655,021 | +8 | 9,331,666 |
Arlington County | 189,453 | +10 | 207,627 | +20 | 249,298 | +10 | 274,339 |
Fairfax County | 969,749 | +12 | 1,081,726 | +7 | 1,162,504 | +7 | 1,244,025 |
Total Working Age Population:
Total Households:
Total Working Age Population:
Total Households:
Total Working Age Population:
Total Households: