Retail Space
5948 Martin Luther King Junior Highway Capitol Heights, MD 20743
5948 Martin Luther King Junior Highway Capitol Heights, MD 20743
Details & Description
Property Highlights
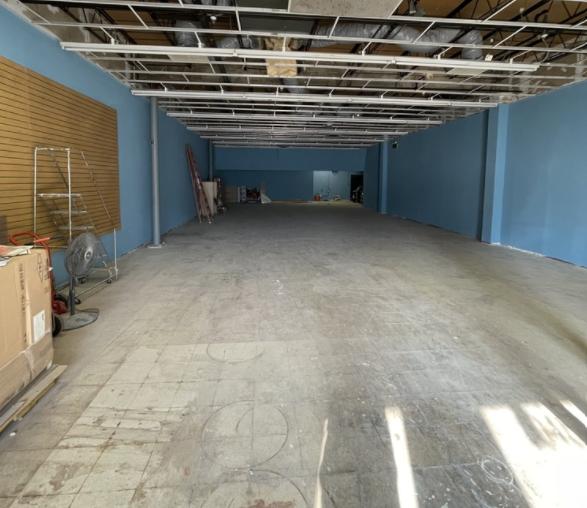
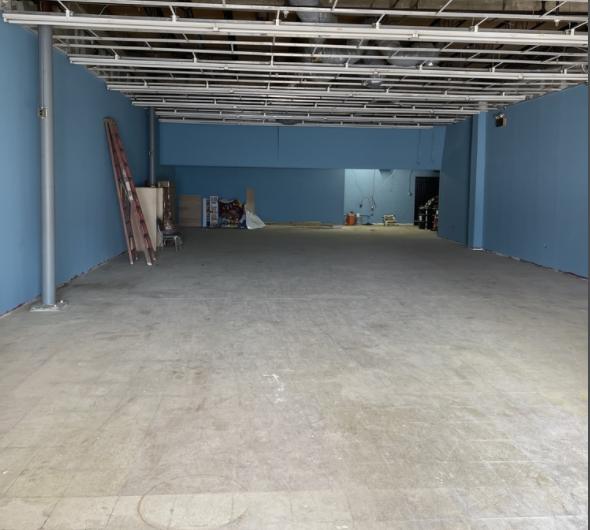
- • First floor large open space with two bathrooms
- • Zoning permits a wide variety of retail uses
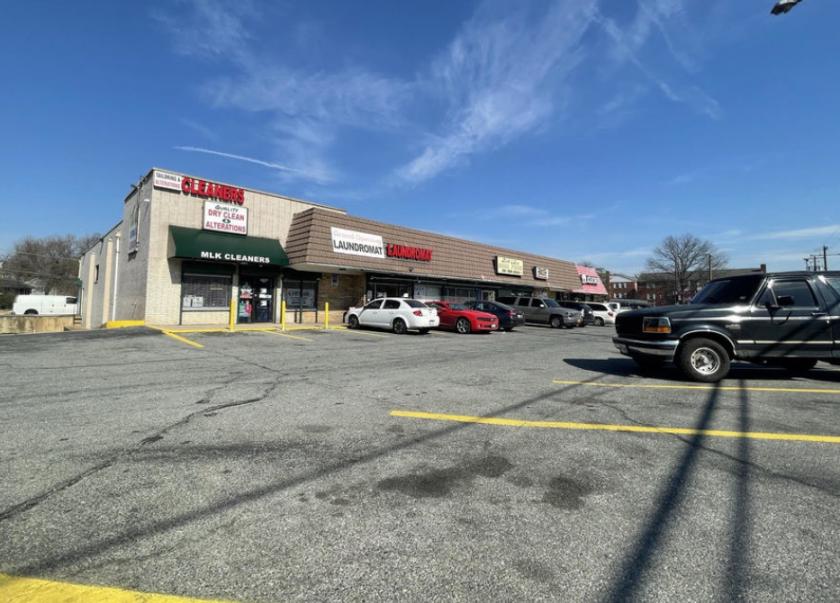
- • Plentiful parking lot
- • Signage facing Martin Luther King Jr Highway
Listing Agents

Shadi Ayyoubi
O: 703-506-2850
shadi.ayyoubi@longandfoster.com
O: 703-506-2850
shadi.ayyoubi@longandfoster.com
While we strive to provide the most accurate information, all listing information, and demographic data, is provided by third-parties. As such, MyEListing will not be responsible for the accuracy of the information. It is strongly recommended that you verify all information with the listing agent, and any relevant agencies, prior to making any decisions.