Office Space
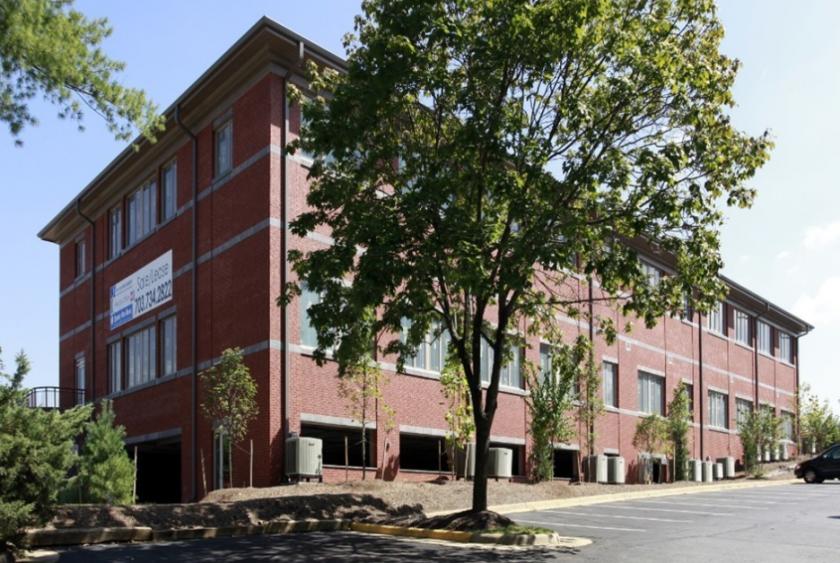
2815 Old Lee Highway Fairfax, VA 22031
2815 Old Lee Highway Fairfax, VA 22031
Details & Description
Property Highlights
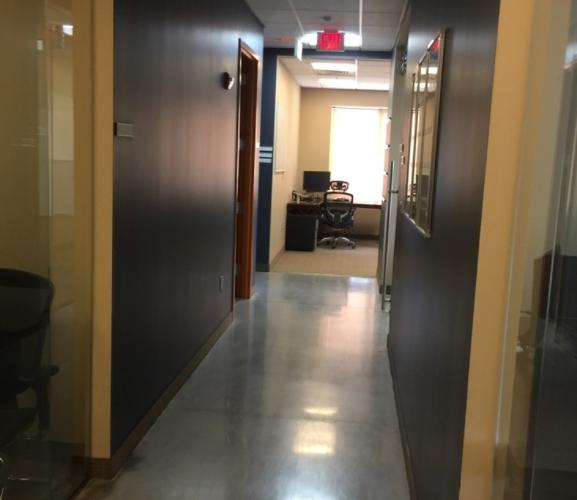
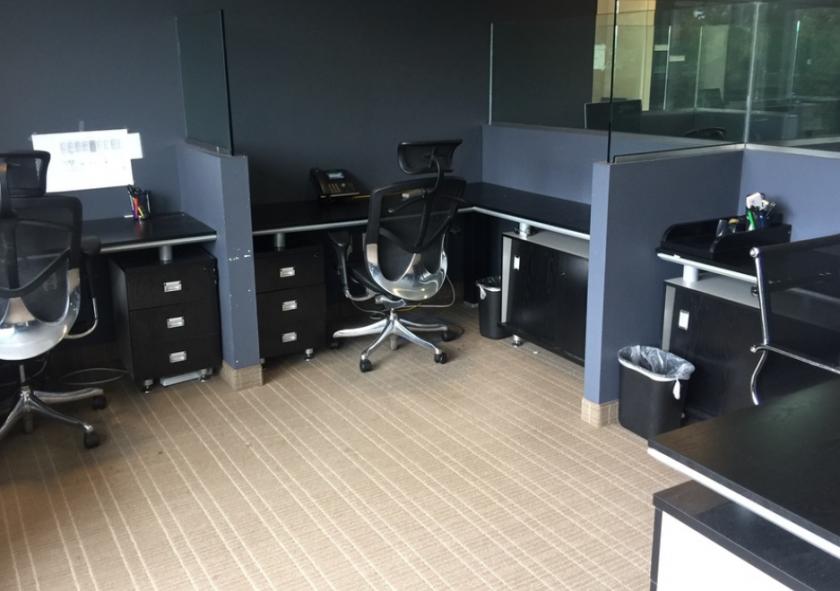
• Building comes fully furnished, and includes multiple amenities on-site Gym, Kitchen, and reception area.
• 2 minute drive from the Mosaic District which includes many restaurants and retail locations.
Listing Agents

Michael Shor
O: 703-342-2250
M: 703-342-2250
michael.shor@lnf.com
O: 703-342-2250
M: 703-342-2250
michael.shor@lnf.com
While we strive to provide the most accurate information, all listing information, and demographic data, is provided by third-parties. As such, MyEListing will not be responsible for the accuracy of the information. It is strongly recommended that you verify all information with the listing agent, and any relevant agencies, prior to making any decisions.