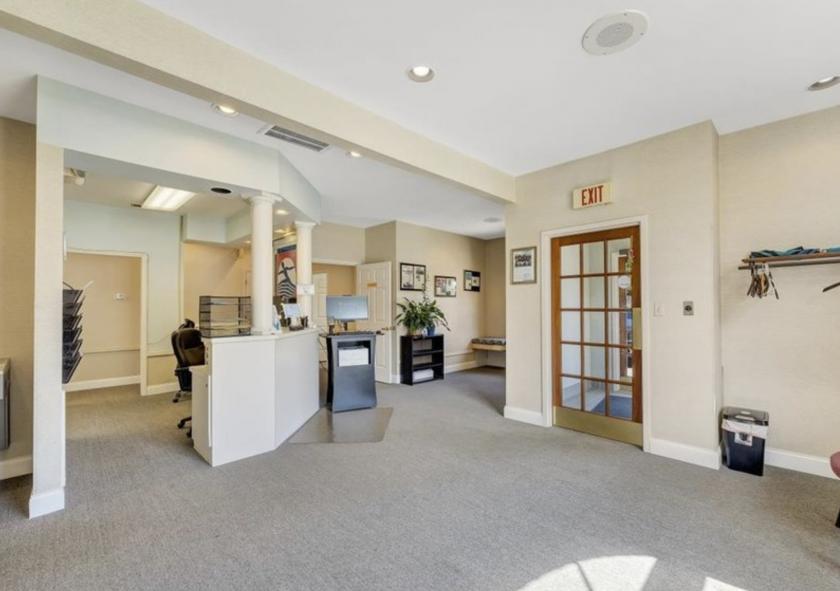
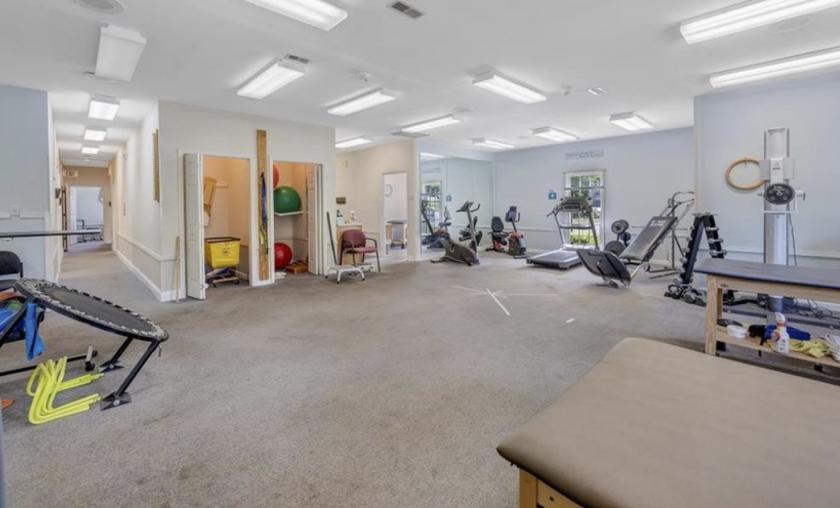
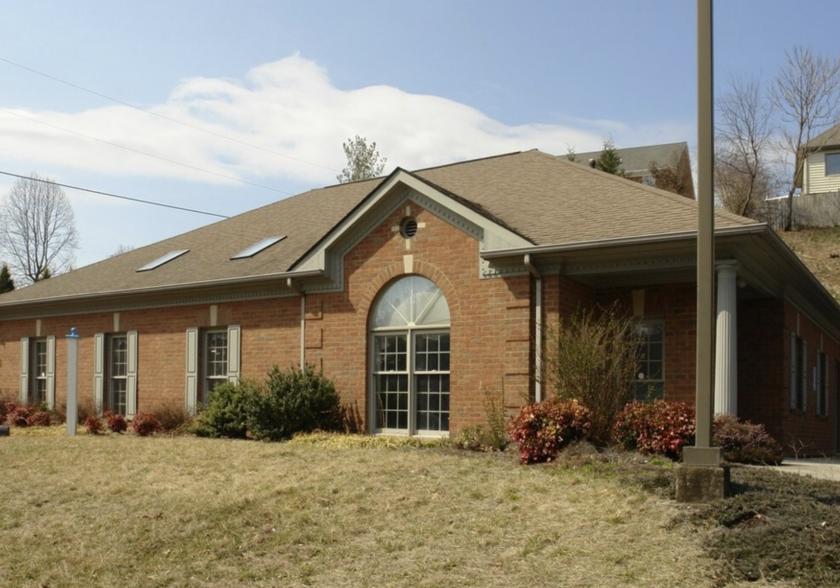
1-Mile | 3-Miles | 5-Miles | ||
---|---|---|---|---|
Total Population | 6,696 | 39,576 | 89,257 | |
Population Median Age | 44 | 43 | 41 | |
Population by Age | 0-9 Yrs | 629 (9%) | 4363 (11%) | 10234 (11%) |
10-19 Yrs | 828 (12%) | 4305 (10%) | 9699 (10%) | |
20-29 Yrs | 611 (9%) | 4344 (10%) | 11054 (12%) | |
30-39 Yrs | 720 (10%) | 4600 (11%) | 11275 (12%) | |
40-49 Yrs | 831 (12%) | 5145 (13%) | 11620 (13%) | |
50-59 Yrs | 932 (13%) | 5252 (13%) | 11940 (13%) | |
60-69 Yrs | 1033 (15%) | 5310 (13%) | 11077 (12%) | |
70+ Yrs | 1113 (16%) | 6256 (15%) | 12359 (13%) | |
Median HH Income | $76,813 | $67,778 | $58,549 | |
Total Household Income | < 24K | 349 (12%) | 2434 (14%) | 7862 (20%) |
25-49K | 394 (14%) | 3548 (20%) | 8566 (22%) | |
50-74K | 600 (21%) | 3646 (21%) | 7571 (19%) | |
75-99K | 407 (14%) | 2205 (12%) | 4503 (11%) | |
100-199K | 753 (27%) | 4122 (23%) | 7403 (19%) | |
200K+ | 241 (8%) | 1335 (7%) | 2780 (7%) | |
Highest Education Level | No Diploma | 265 | 1556 | 5834 |
Diploma or GED | 894 | 5234 | 15040 | |
Some College | 807 | 5308 | 11623 | |
Assoc. Degree | 475 | 3229 | 6727 | |
Bachelors Degree | 1471 | 8186 | 15007 | |
Higher Degree | 1026 | 5529 | 10359 | |
Total Housing Units | 2,908 | 18,744 | 42,896 | |
--Owner-Occupied | 2,003 | 11,440 | 22,892 | |
--Renter-Occupied | 740 | 5,851 | 15,793 | |
Owner-Occupied Values | < 100K | 17 | 446 | 2262 |
100-199K | 671 | 4377 | 8987 | |
200-299K | 871 | 3794 | 6070 | |
300-399K | 323 | 1540 | 2889 | |
400-499K | 62 | 574 | 1191 | |
500K+ | 58 | 710 | 1494 | |
Total Working Age Population | 5,550 | 32,692 | 73,173 | |
In Work Force | 3,384 | 20,941 | 46,748 | |
Not In Work Force | 2,165 | 11,750 | 26,425 | |
Workforce Employed | 3,257 | 20,246 | 44,995 | |
Workforce Unemployed | 128 | 680 | 1,704 | |
Civlian Workforce | 3,384 | 20,926 | 46,698 | |
Military Workforce | 0 | 15 | 49 | |
Total Households | 2,743 | 17,291 | 38,685 | |
Family Households | 1,846 | 10,750 | 22,402 | |
Non-Family Households | 897 | 6,541 | 16,283 | |
Married Couple | 1,485 | 8,494 | 16,457 | |
Other Family | 361 | 2,255 | 5,946 | |
Married w/Child | 522 | 2,925 | 5,511 | |
Single Male w/Child | 82 | 517 | 928 | |
Single Female w/Child | 158 | 898 | 2,515 |
Population Change Last Two Decades - Plus Projection
2000 | % | 2010 | % | 2020 | % | 2030 | |
---|---|---|---|---|---|---|---|
Virginia | 7,078,515 | +13 | 8,001,024 | +8 | 8,655,021 | +8 | 9,331,666 |
Franklin County | 47,286 | +19 | 56,159 | 0 | 56,237 | +7 | 60,354 |
Roanoke County | 85,778 | +8 | 92,376 | +2 | 94,145 | +3 | 97,249 |
Roanoke city | 94,911 | +2 | 97,032 | +4 | 100,891 | +1 | 102,388 |
Salem city | 24,747 | 0 | 24,802 | +5 | 25,953 | +1 | 26,141 |
Total Working Age Population:
Total Households:
Total Working Age Population:
Total Households:
Total Working Age Population:
Total Households: