Retail Space
1652 New Jersey 35 Keyport, NJ 07735
1652 New Jersey 35 Keyport, NJ 07735

Details & Description
Property Highlights
• Fountain Ridge is a three-building officeretail center
• Amenities include outdoor seating areas and fountain
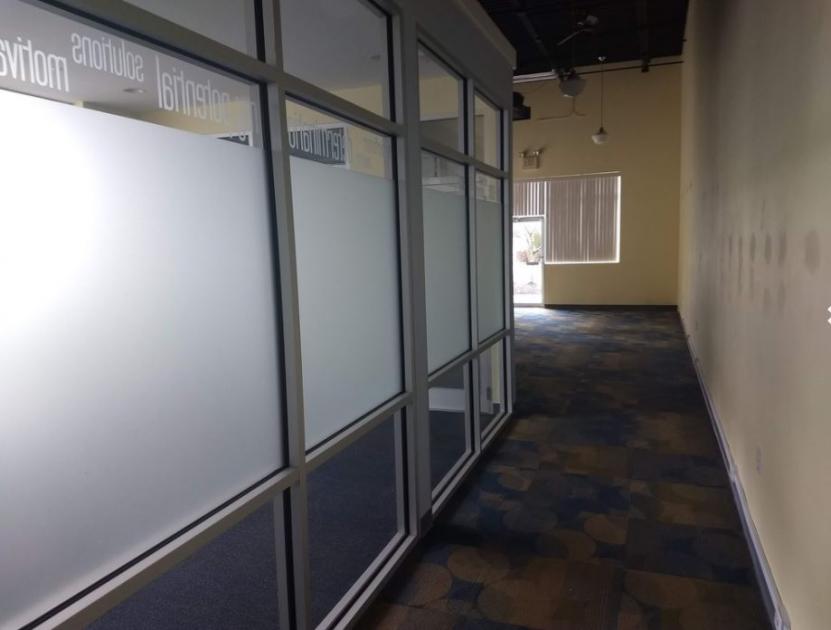
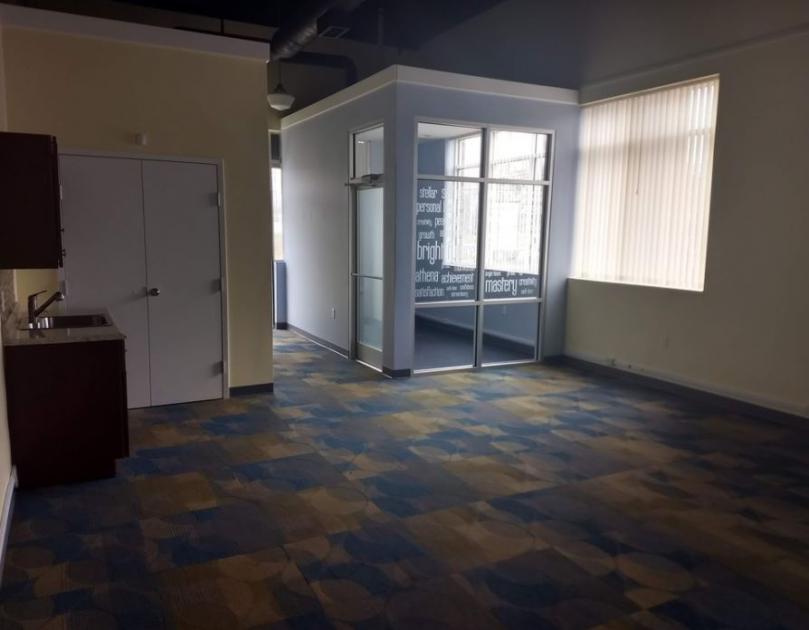
Additional Photos

Listing Agents

Joseph Allegro
O: 732-623-2145
M: 201-988-5534
allegro@sitarcompany.com
O: 732-623-2145
M: 201-988-5534
allegro@sitarcompany.com
While we strive to provide the most accurate information, all listing information, and demographic data, is provided by third-parties. As such, MyEListing will not be responsible for the accuracy of the information. It is strongly recommended that you verify all information with the listing agent, and any relevant agencies, prior to making any decisions.


