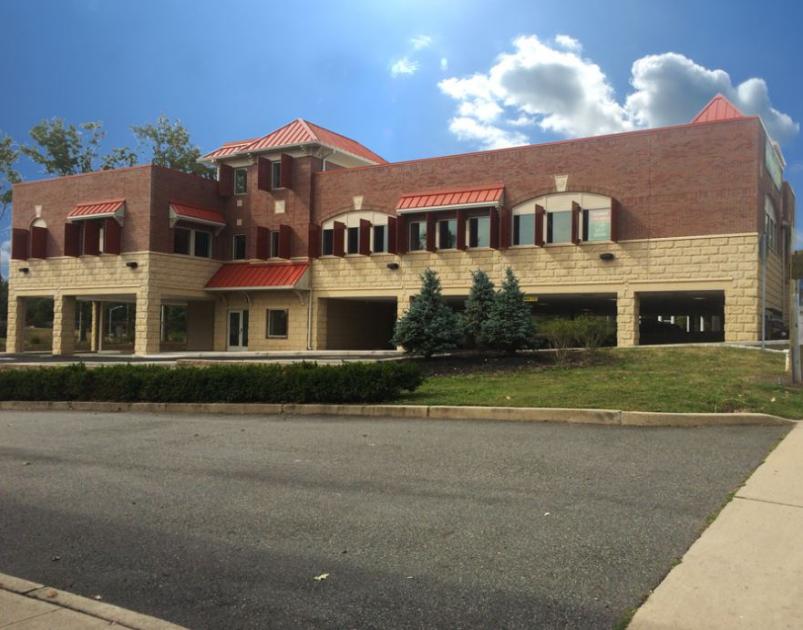
Office Space
1477 Oak Tree Road Woodbridge Township, NJ 08830
1477 Oak Tree Road Woodbridge Township, NJ 08830
Details & Description
Property Highlights
- • Covered parking
- • Signage visible to Garden State Parkway
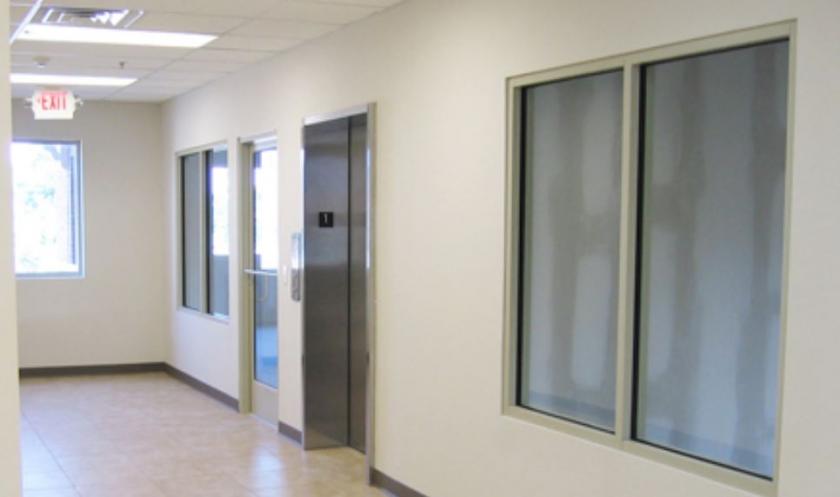
- • Elevator
- • Room to expand into contiguous space
- • LEEDs Gold Certified Energy Efficient Building
- • Owner is a licensed NJ Real Estate Broker
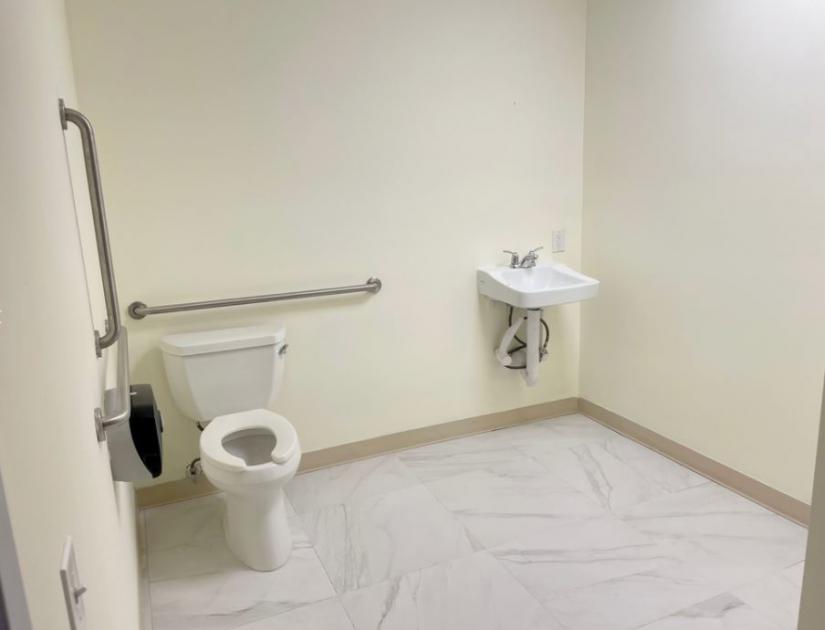
Additional Photos

Listing Agents

William Sitar Sr.
O: 732-283-9000
M: 908-510-9600
sitar@sitarcompany.com
O: 732-283-9000
M: 908-510-9600
sitar@sitarcompany.com
While we strive to provide the most accurate information, all listing information, and demographic data, is provided by third-parties. As such, MyEListing will not be responsible for the accuracy of the information. It is strongly recommended that you verify all information with the listing agent, and any relevant agencies, prior to making any decisions.


