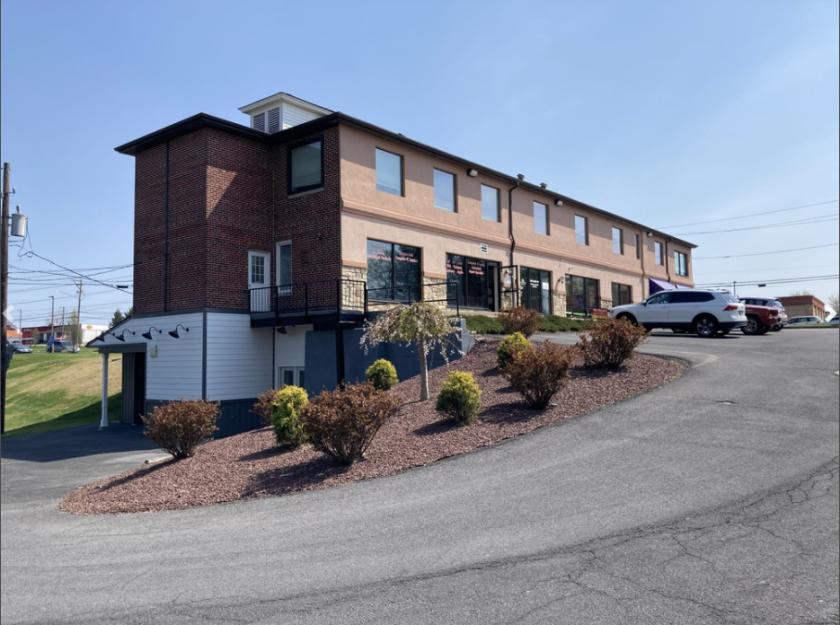
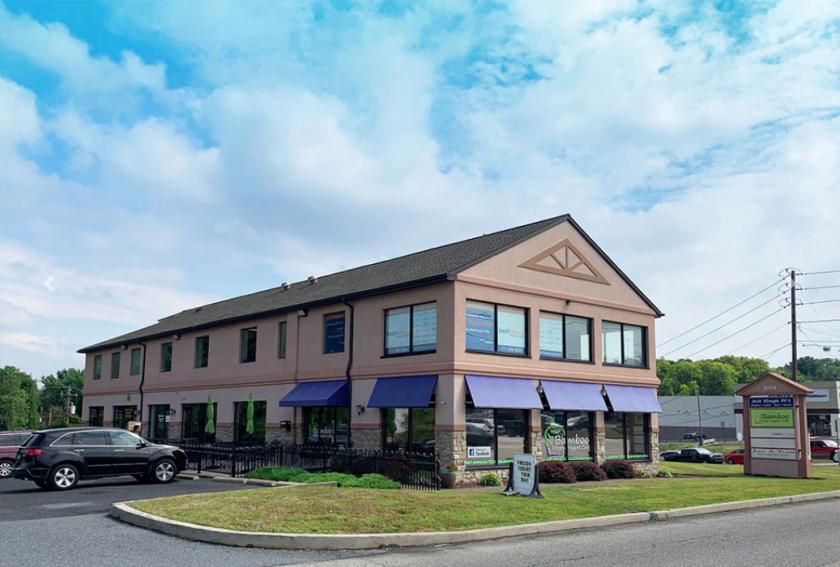
Retail Space
5001 Carlisle Pike Mechanicsburg, PA 17050
5001 Carlisle Pike Mechanicsburg, PA 17050
Details & Description
Property Highlights
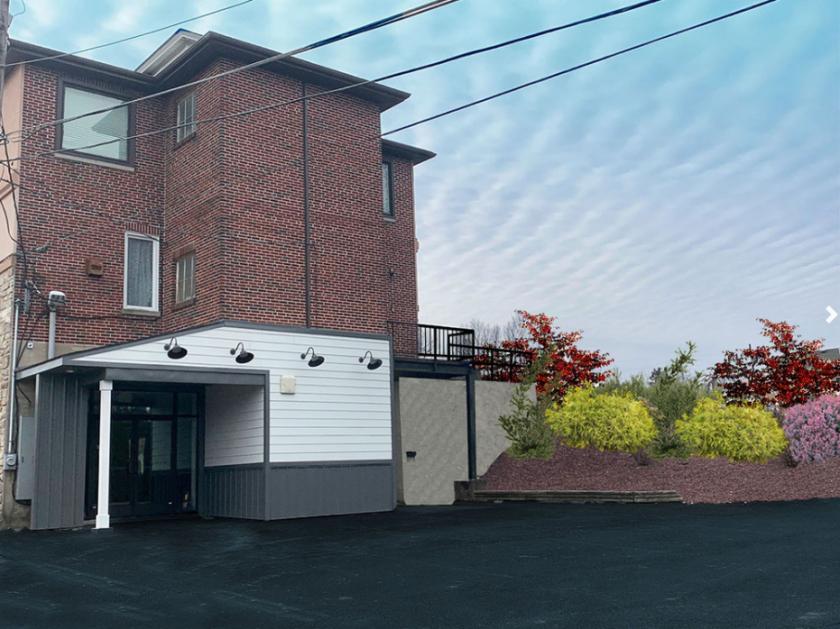
- • 3,000 SF available with open buildout
- • Private on-grade entrance to space
- • Abundant parking and two points of access
Listing Agents

Justin Shoemaker
O: 717-731-1990
justin@landmarkcr.com
O: 717-731-1990
justin@landmarkcr.com

Nick Sallack
O: 717-731-1990
M: 717-829-4011
nsallack@landmarkcr.com
O: 717-731-1990
M: 717-829-4011
nsallack@landmarkcr.com
While we strive to provide the most accurate information, all listing information, and demographic data, is provided by third-parties. As such, MyEListing will not be responsible for the accuracy of the information. It is strongly recommended that you verify all information with the listing agent, and any relevant agencies, prior to making any decisions.