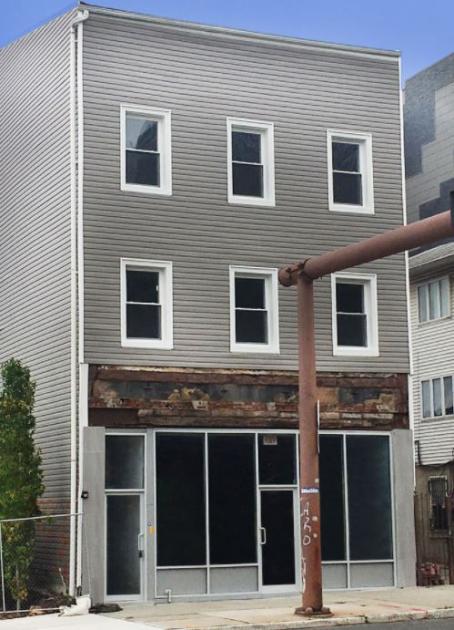
Retail Space
360 Broad Street Newark, NJ 07104
360 Broad Street Newark, NJ 07104
Details & Description
Property Highlights
- • Price reduced
- • Lender owned motivated seller
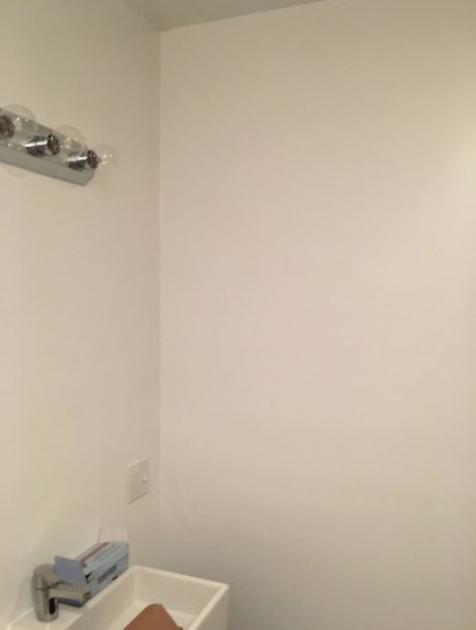
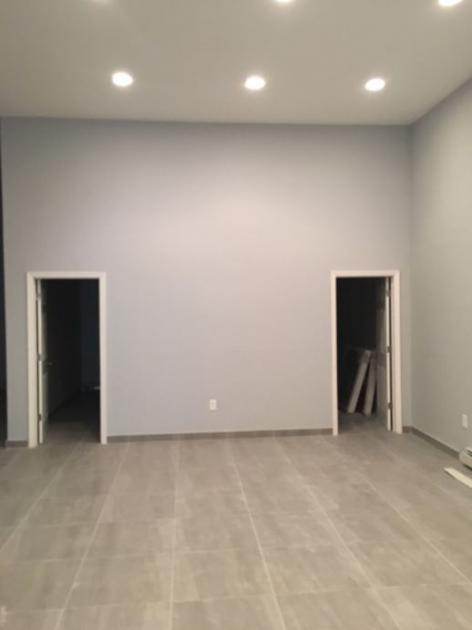
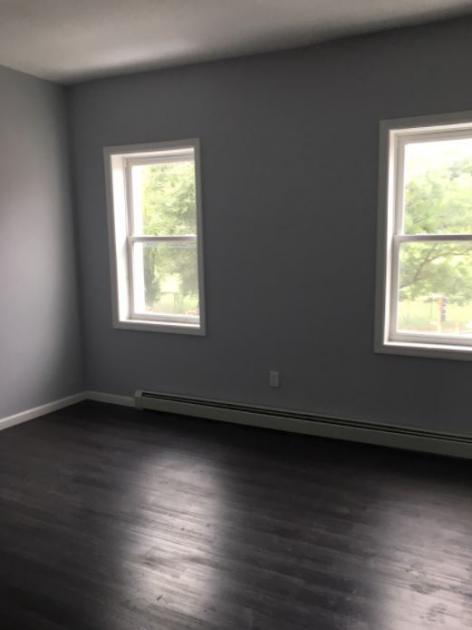
- • 3 new large 2 bedroom, 1 bath apartments
- • Ground floor retail
- • Full basement
- • Lot measures 25 x 154
Additional Photos
Listing Agents

Brian Murphy
O: 732-623-2156
M: 732-539-3098
murphy@sitarcompany.com
O: 732-623-2156
M: 732-539-3098
murphy@sitarcompany.com
While we strive to provide the most accurate information, all listing information, and demographic data, is provided by third-parties. As such, MyEListing will not be responsible for the accuracy of the information. It is strongly recommended that you verify all information with the listing agent, and any relevant agencies, prior to making any decisions.


