Specialty Real Estate
865 Westfield Avenue Elizabeth, NJ 07208
865 Westfield Avenue Elizabeth, NJ 07208
Details & Description
Property Highlights
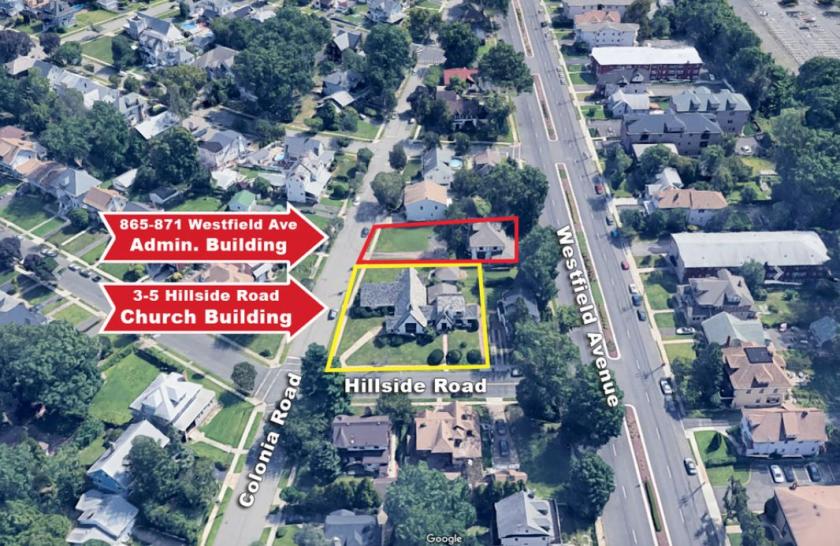
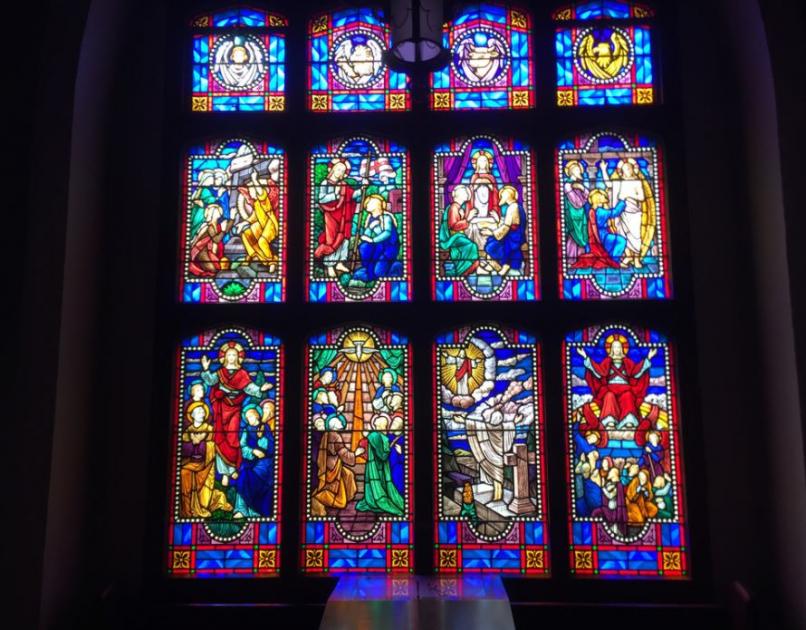
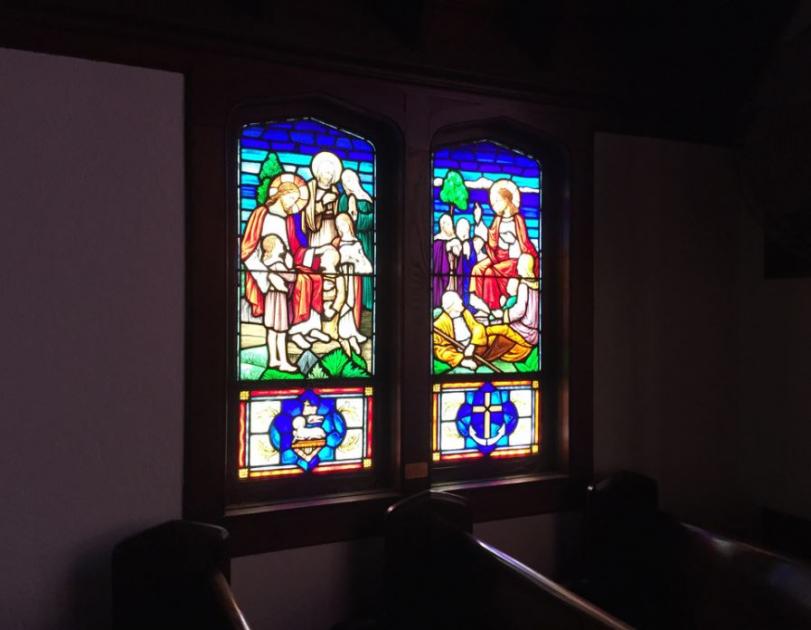
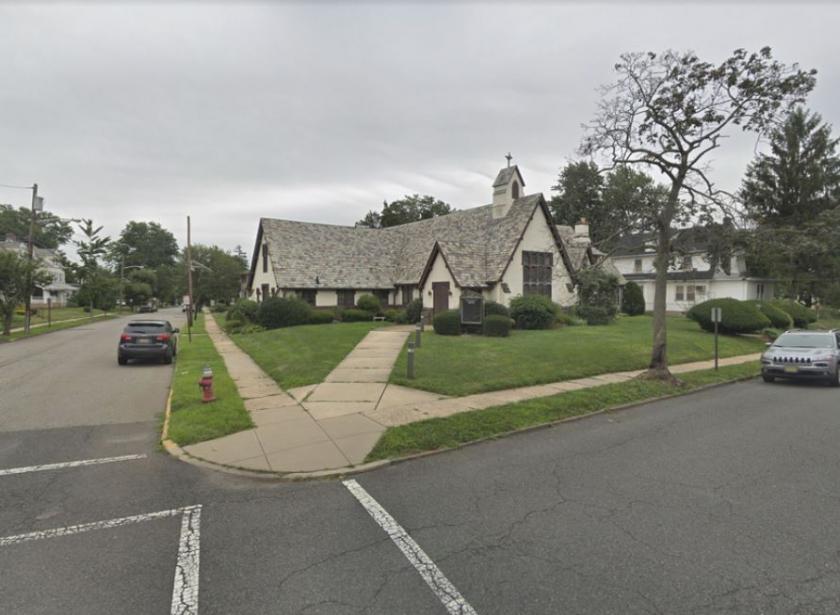
• The church measures -3,157 SF, has 25 vaulted ceilings, stained glass, wooden pews, a private office and seats 160.
• Complex contains a church and attached 3 bedroom residential dwelling plus a 2,500 SF administrative building
Additional Photos
Listing Agents

Brian Murphy
O: 732-623-2156
M: 732-539-3098
murphy@sitarcompany.com
O: 732-623-2156
M: 732-539-3098
murphy@sitarcompany.com
While we strive to provide the most accurate information, all listing information, and demographic data, is provided by third-parties. As such, MyEListing will not be responsible for the accuracy of the information. It is strongly recommended that you verify all information with the listing agent, and any relevant agencies, prior to making any decisions.


