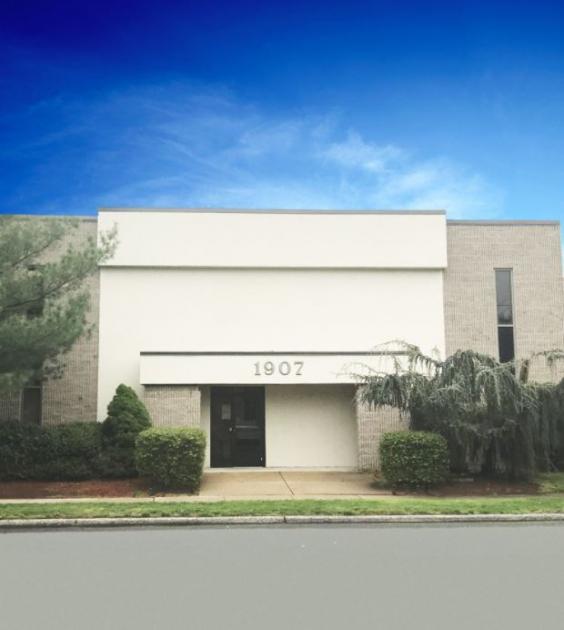
Office Space
1907 Park Avenue South Plainfield, NJ 07080
1907 Park Avenue South Plainfield, NJ 07080
Details & Description
Property Highlights
- • Constructed in 1981
- • Over 50 parking spaces
- • Bathrooms are central and also in suites
- • Elevator in building
- • Rental rate does not include utilities
- • Purchase opportunity for entire building
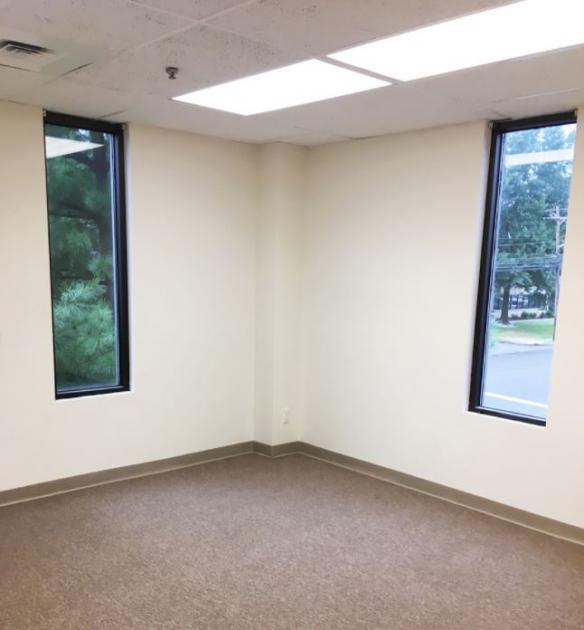
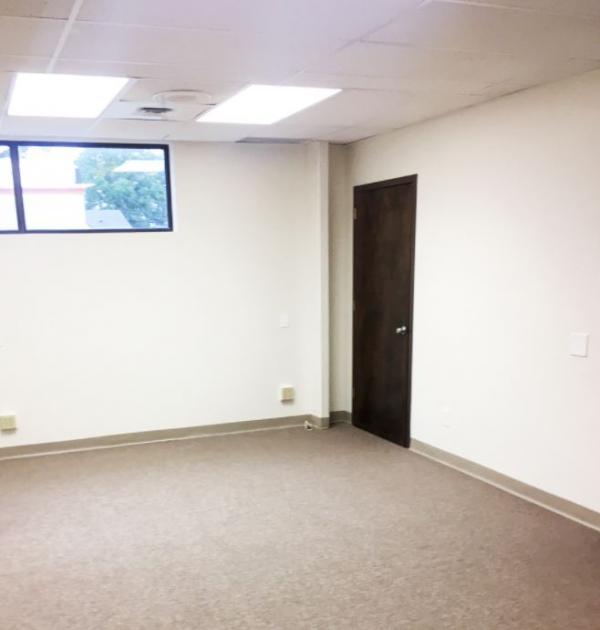
Additional Photos

Listing Agents

Douglas Sitar
O: 732-283-9000
M: 732-859-2144
dsitar@sitarcompany.com
O: 732-283-9000
M: 732-859-2144
dsitar@sitarcompany.com
While we strive to provide the most accurate information, all listing information, and demographic data, is provided by third-parties. As such, MyEListing will not be responsible for the accuracy of the information. It is strongly recommended that you verify all information with the listing agent, and any relevant agencies, prior to making any decisions.


