Specialty Real Estate
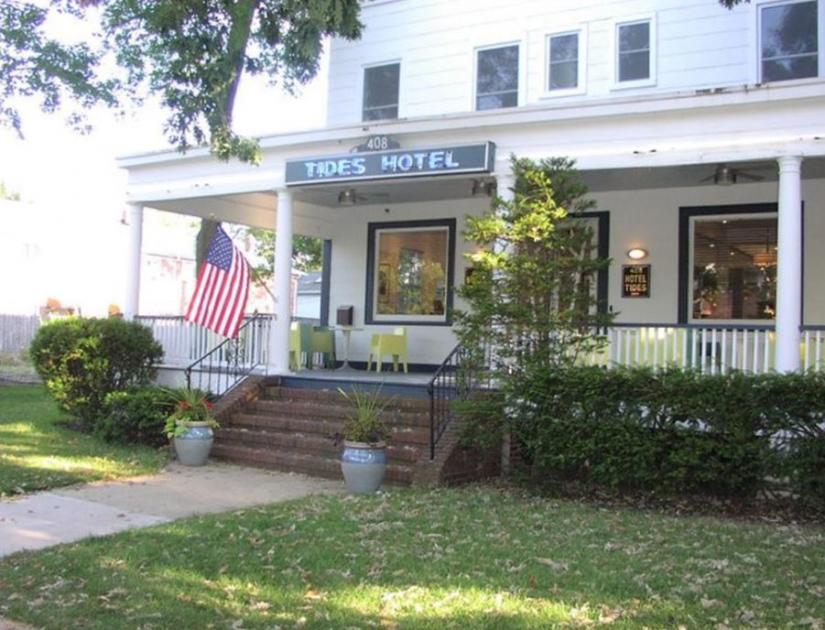
408 7th Avenue Asbury Park, NJ 07712
408 7th Avenue Asbury Park, NJ 07712

Details & Description
Property Highlights
- • Plenary 33 liquor license included in sale.
- • Gut renovations completed in 2008
- • 20 hotel rooms
- • Inground pool
- • Off-street parking
- • Taxes $24,860 2020
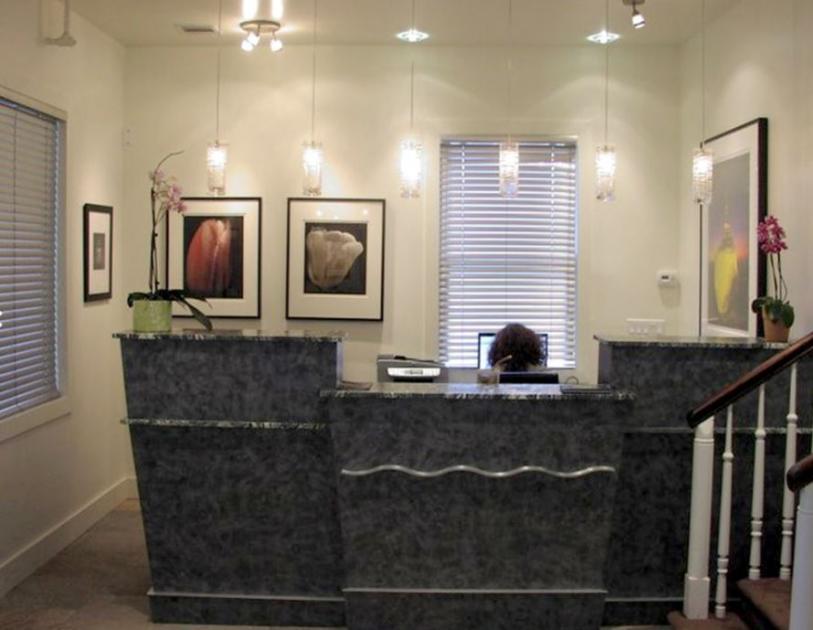
Additional Photos

Listing Agents

Suzanne Crosby
O: 732-449-2000
crosby@sitarcompany.com
O: 732-449-2000
crosby@sitarcompany.com
While we strive to provide the most accurate information, all listing information, and demographic data, is provided by third-parties. As such, MyEListing will not be responsible for the accuracy of the information. It is strongly recommended that you verify all information with the listing agent, and any relevant agencies, prior to making any decisions.


