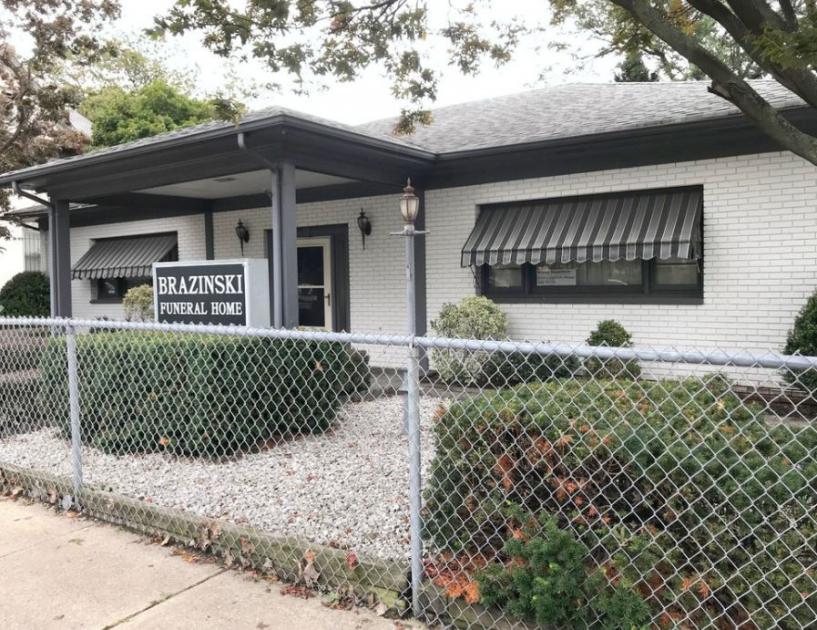
Specialty Real Estate
149 Second Street Elizabeth, NJ 07206
149 Second Street Elizabeth, NJ 07206
Details & Description
Property Highlights
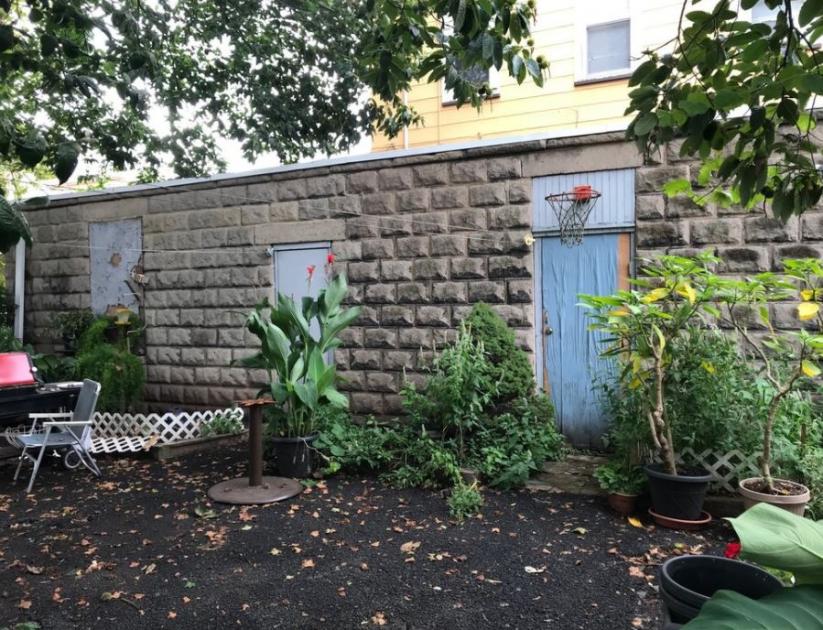
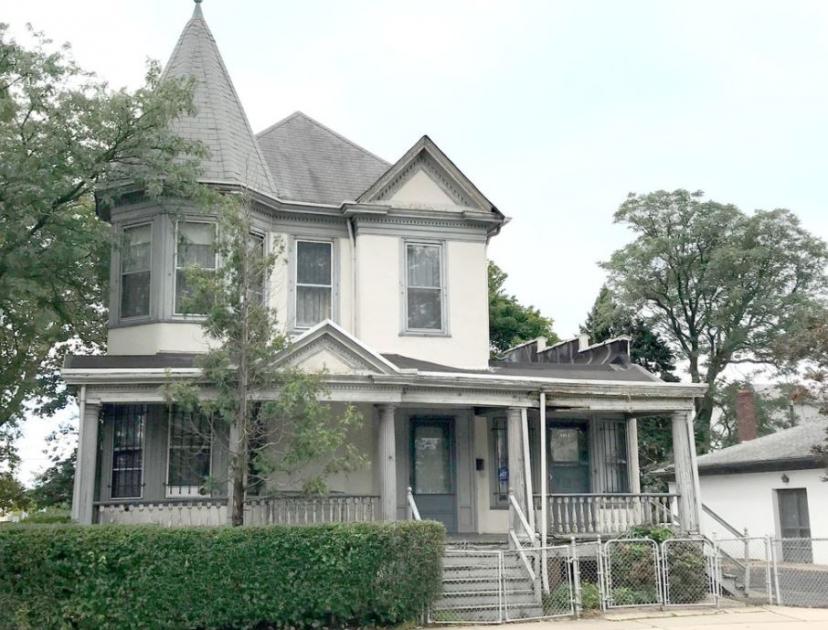
• Single Family House 149-151 Lot Size 0.08 acres taxes 6,618year, building size 2,258 SF
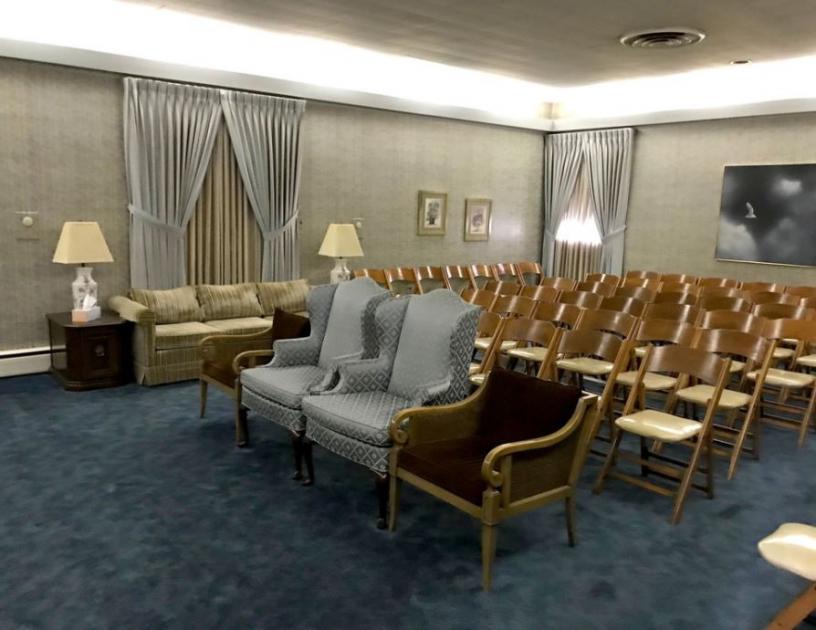
• Funeral Home 137-149 Lot Size 0.37 acres taxes $25,246year building size 3,824 SF
Additional Photos
Listing Agents

Suzanne Crosby
O: 732-449-2000
crosby@sitarcompany.com
O: 732-449-2000
crosby@sitarcompany.com
While we strive to provide the most accurate information, all listing information, and demographic data, is provided by third-parties. As such, MyEListing will not be responsible for the accuracy of the information. It is strongly recommended that you verify all information with the listing agent, and any relevant agencies, prior to making any decisions.


