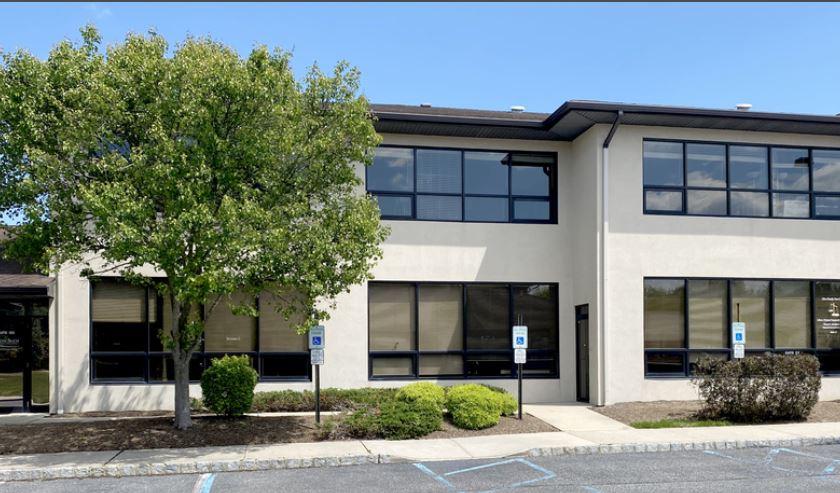
Office Space
74 Brick Boulevard Brick Township, NJ 08723
74 Brick Boulevard Brick Township, NJ 08723
Details & Description
Property Highlights
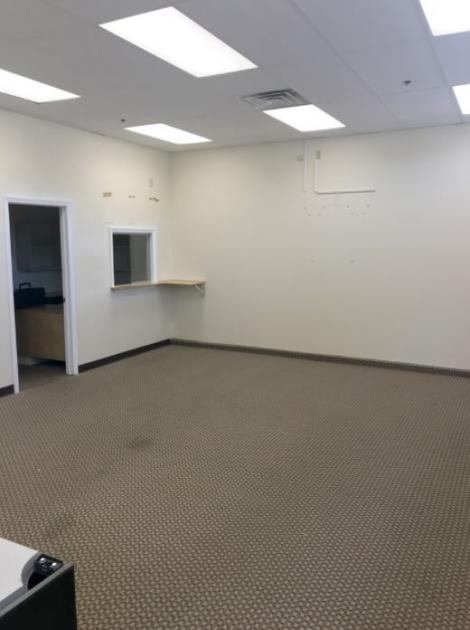
• Space contains 6 exam rooms and several administrative and doctors offices
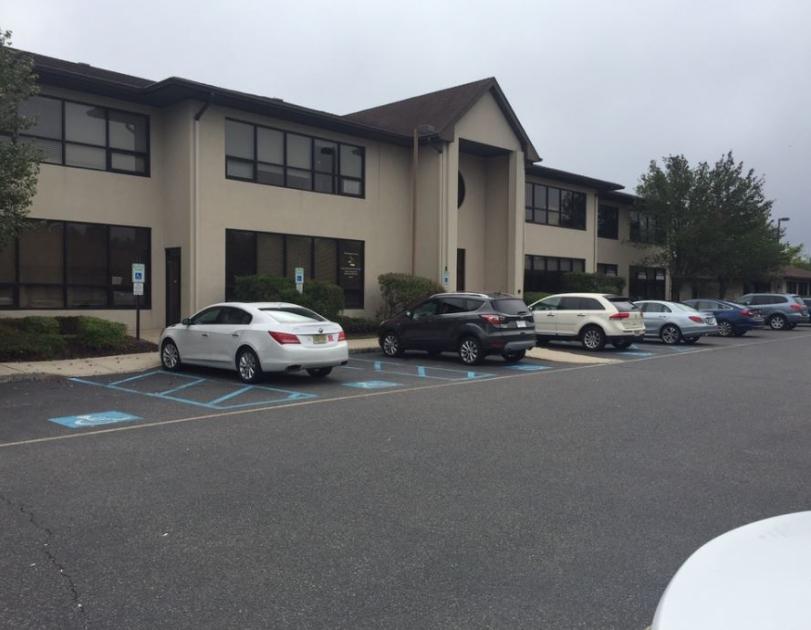
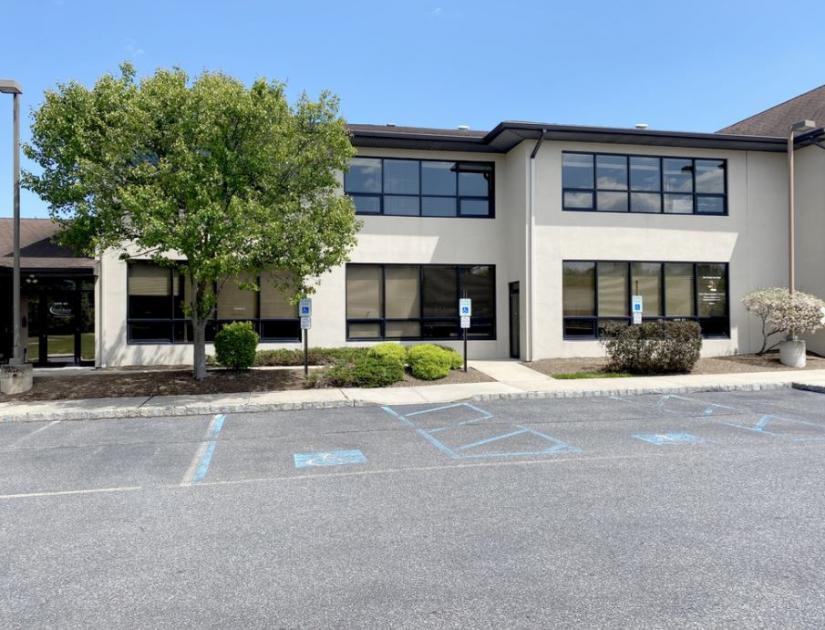
• In the vicinity of restaurants, retail and hotels, all on Brick Boulevard
Additional Photos
Listing Agents

William Sitar Jr.
O: 732-623-2155
M: 973-202-9119
bsitarlaw@sitarcompany.com
O: 732-623-2155
M: 973-202-9119
bsitarlaw@sitarcompany.com
While we strive to provide the most accurate information, all listing information, and demographic data, is provided by third-parties. As such, MyEListing will not be responsible for the accuracy of the information. It is strongly recommended that you verify all information with the listing agent, and any relevant agencies, prior to making any decisions.


