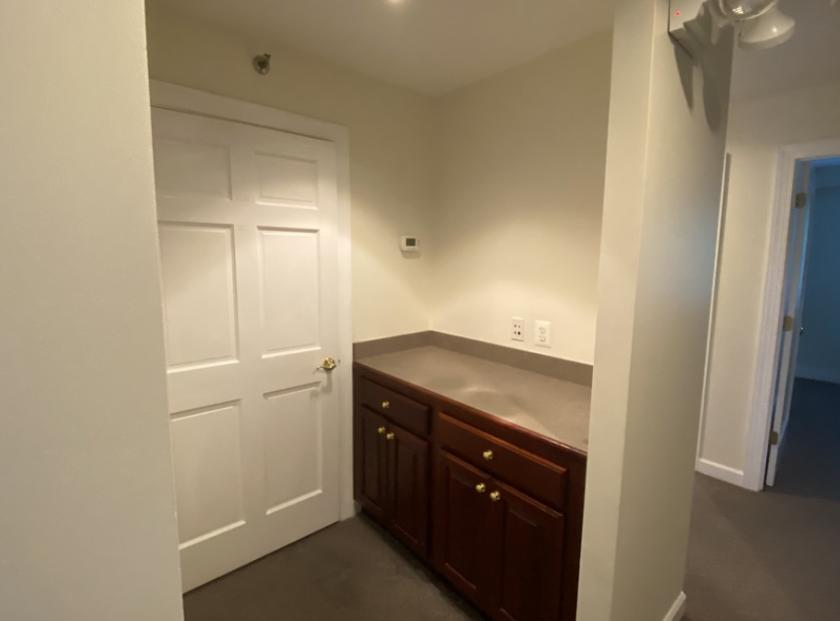
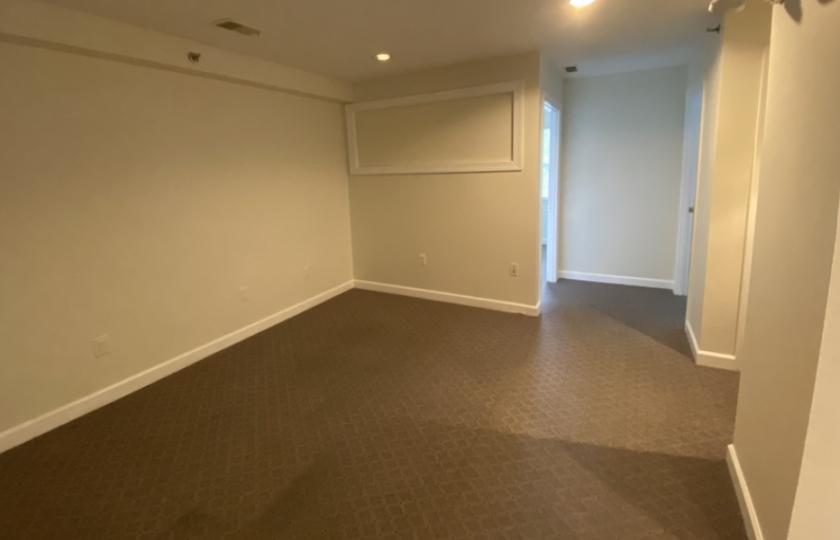
1-Mile | 3-Miles | 5-Miles | ||
---|---|---|---|---|
Total Population | 2,148 | 21,547 | 105,006 | |
Population Median Age | 45 | 43 | 41 | |
Population by Age | 0-9 Yrs | 201 (9%) | 2265 (10%) | 11669 (11%) |
10-19 Yrs | 310 (14%) | 3158 (14%) | 13614 (12%) | |
20-29 Yrs | 165 (7%) | 1781 (8%) | 10572 (10%) | |
30-39 Yrs | 123 (5%) | 1467 (6%) | 11252 (10%) | |
40-49 Yrs | 240 (11%) | 2697 (12%) | 14199 (13%) | |
50-59 Yrs | 383 (17%) | 3927 (18%) | 17871 (17%) | |
60-69 Yrs | 337 (15%) | 3390 (15%) | 14135 (13%) | |
70+ Yrs | 390 (18%) | 2863 (13%) | 11694 (11%) | |
Median HH Income | $200000+ | $200000+ | $165,885 | |
Total Household Income | < 24K | 23 (3%) | 257 (3%) | 2066 (5%) |
25-49K | 47 (6%) | 268 (3%) | 2399 (6%) | |
50-74K | 27 (3%) | 294 (4%) | 2564 (6%) | |
75-99K | 34 (4%) | 551 (7%) | 3663 (9%) | |
100-199K | 182 (25%) | 1896 (26%) | 12785 (32%) | |
200K+ | 395 (55%) | 3953 (54%) | 15449 (39%) | |
Highest Education Level | No Diploma | 25 | 240 | 2088 |
Diploma or GED | 117 | 908 | 5387 | |
Some College | 152 | 1259 | 7195 | |
Assoc. Degree | 54 | 554 | 2926 | |
Bachelors Degree | 552 | 5485 | 26582 | |
Higher Degree | 638 | 6741 | 30183 | |
Total Housing Units | 761 | 7,604 | 41,082 | |
--Owner-Occupied | 663 | 6,771 | 30,398 | |
--Renter-Occupied | 44 | 448 | 8,527 | |
Owner-Occupied Values | < 100K | 6 | 32 | 237 |
100-199K | 0 | 66 | 508 | |
200-299K | 4 | 71 | 1221 | |
300-399K | 0 | 69 | 2089 | |
400-499K | 0 | 234 | 3294 | |
500K+ | 654 | 6299 | 23049 | |
Total Working Age Population | 1,735 | 17,363 | 84,895 | |
In Work Force | 959 | 10,888 | 57,733 | |
Not In Work Force | 776 | 6,475 | 27,161 | |
Workforce Employed | 910 | 10,362 | 55,438 | |
Workforce Unemployed | 43 | 501 | 2,072 | |
Civlian Workforce | 953 | 10,863 | 57,511 | |
Military Workforce | 6 | 25 | 223 | |
Total Households | 708 | 7,219 | 38,925 | |
Family Households | 651 | 6,291 | 28,361 | |
Non-Family Households | 56 | 928 | 10,564 | |
Married Couple | 592 | 5,714 | 24,987 | |
Other Family | 60 | 578 | 3,374 | |
Married w/Child | 196 | 2,289 | 10,270 | |
Single Male w/Child | 0 | 38 | 367 | |
Single Female w/Child | 23 | 141 | 1,171 |
Population Change Last Two Decades - Plus Projection
2000 | % | 2010 | % | 2020 | % | 2030 | |
---|---|---|---|---|---|---|---|
Maryland | 5,296,486 | +9 | 5,773,552 | +6 | 6,141,900 | +6 | 6,518,750 |
Montgomery County | 873,341 | +11 | 971,777 | +8 | 1,052,050 | +7 | 1,128,800 |
Virginia | 7,078,515 | +13 | 8,001,024 | +8 | 8,655,021 | +8 | 9,331,666 |
Fairfax County | 969,749 | +12 | 1,081,726 | +7 | 1,162,504 | +7 | 1,244,025 |
Loudoun County | 169,599 | +84 | 312,311 | +38 | 430,584 | +29 | 554,808 |
Prince William County | 280,813 | +43 | 402,002 | +19 | 478,134 | +20 | 571,844 |
Total Working Age Population:
Total Households:
Total Working Age Population:
Total Households:
Total Working Age Population:
Total Households: