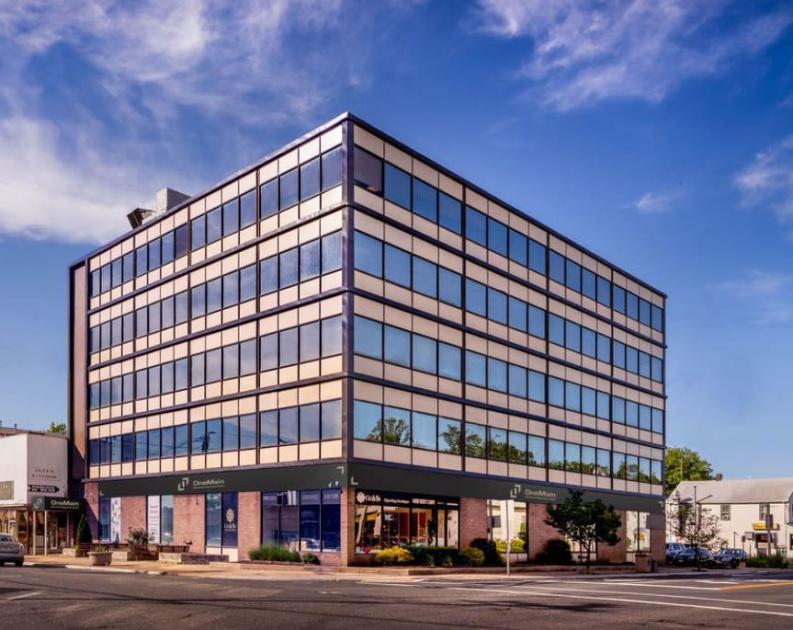
Retail Space
1 Main Street Eatontown, NJ 07724
1 Main Street Eatontown, NJ 07724
Details & Description
Property Highlights
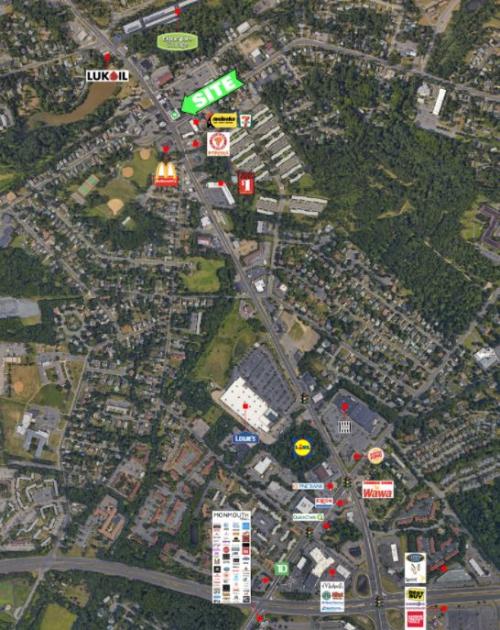
• In close proximity to Monmouth Mall, Monmouth Racetrack, the Jersey Shore and Little Silver train station.
• Ideal uses include financial and legal services, bank, coffeebakery, convenience store, etc.
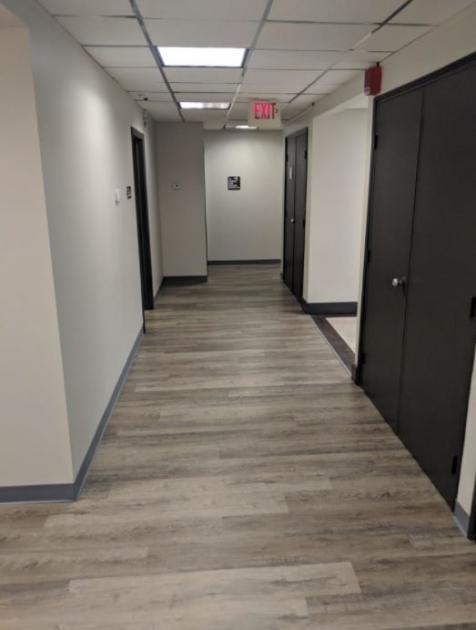
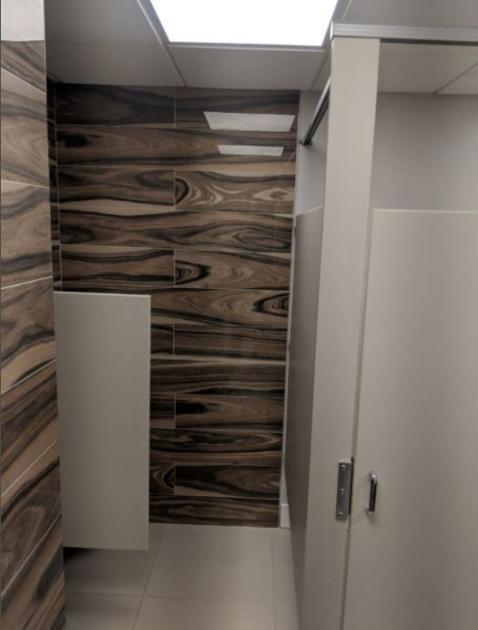
Additional Photos
Listing Agents

Justin Goodman
O: 732-449-2000
goodman@sitarcompany.com
O: 732-449-2000
goodman@sitarcompany.com
While we strive to provide the most accurate information, all listing information, and demographic data, is provided by third-parties. As such, MyEListing will not be responsible for the accuracy of the information. It is strongly recommended that you verify all information with the listing agent, and any relevant agencies, prior to making any decisions.


