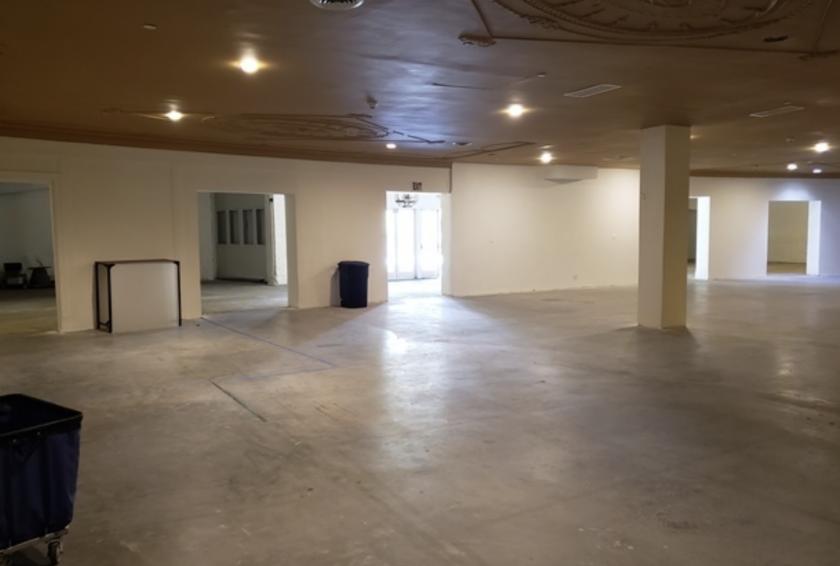
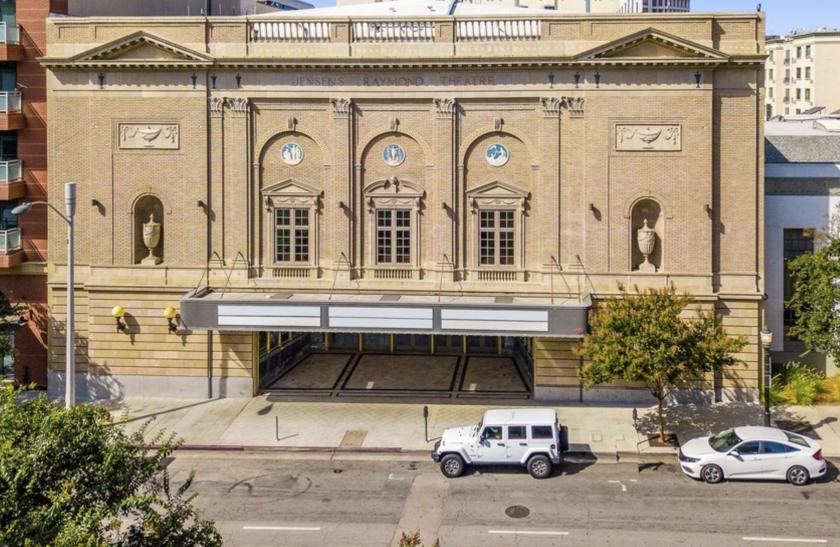
1-Mile | 3-Miles | 5-Miles | ||
---|---|---|---|---|
Total Population | 35,753 | 195,097 | 509,355 | |
Population Median Age | 38 | 40 | 40 | |
Population by Age | 0-9 Yrs | 3575 (9%) | 22342 (11%) | 56611 (11%) |
10-19 Yrs | 2928 (8%) | 19203 (9%) | 52026 (10%) | |
20-29 Yrs | 7174 (20%) | 28109 (14%) | 71461 (14%) | |
30-39 Yrs | 6929 (19%) | 30477 (15%) | 76310 (14%) | |
40-49 Yrs | 4656 (13%) | 27907 (14%) | 72404 (14%) | |
50-59 Yrs | 3929 (10%) | 24973 (12%) | 68833 (13%) | |
60-69 Yrs | 3293 (9%) | 20971 (10%) | 55367 (10%) | |
70+ Yrs | 3269 (9%) | 21114 (10%) | 56344 (11%) | |
Median HH Income | $70,460 | $84,788 | $81,745 | |
Total Household Income | < 24K | 3877 (25%) | 12849 (17%) | 30023 (16%) |
25-49K | 2121 (13%) | 9919 (13%) | 27923 (15%) | |
50-74K | 2145 (13%) | 10548 (14%) | 26589 (14%) | |
75-99K | 1986 (12%) | 9063 (12%) | 21582 (11%) | |
100-199K | 3761 (24%) | 20034 (27%) | 48126 (26%) | |
200K+ | 1562 (10%) | 11317 (15%) | 26474 (14%) | |
Highest Education Level | No Diploma | 3751 | 17139 | 51209 |
Diploma or GED | 3010 | 19929 | 61370 | |
Some College | 4132 | 23304 | 61713 | |
Assoc. Degree | 1758 | 9249 | 25588 | |
Bachelors Degree | 7058 | 39112 | 100376 | |
Higher Degree | 6830 | 34176 | 71029 | |
Total Housing Units | 17,852 | 81,462 | 196,578 | |
--Owner-Occupied | 3,026 | 32,699 | 88,847 | |
--Renter-Occupied | 12,425 | 41,031 | 91,869 | |
Owner-Occupied Values | < 100K | 21 | 327 | 1260 |
100-199K | 10 | 263 | 740 | |
200-299K | 82 | 319 | 1231 | |
300-399K | 324 | 1447 | 4108 | |
400-499K | 474 | 2401 | 7262 | |
500K+ | 2115 | 27942 | 74247 | |
Total Working Age Population | 30,439 | 161,109 | 421,576 | |
In Work Force | 20,209 | 106,387 | 274,345 | |
Not In Work Force | 10,230 | 54,722 | 147,231 | |
Workforce Employed | 19,449 | 101,636 | 260,534 | |
Workforce Unemployed | 752 | 4,736 | 13,665 | |
Civlian Workforce | 20,201 | 106,372 | 274,198 | |
Military Workforce | 8 | 15 | 147 | |
Total Households | 15,451 | 73,730 | 180,717 | |
Family Households | 6,959 | 43,672 | 118,070 | |
Non-Family Households | 8,492 | 30,058 | 62,647 | |
Married Couple | 5,001 | 32,006 | 84,969 | |
Other Family | 1,958 | 11,665 | 33,100 | |
Married w/Child | 1,819 | 12,848 | 34,090 | |
Single Male w/Child | 229 | 1,511 | 3,751 | |
Single Female w/Child | 592 | 3,185 | 8,229 |
Population Change Last Two Decades - Plus Projection
2000 | % | 2010 | % | 2020 | % | 2030 | |
---|---|---|---|---|---|---|---|
California | 33,871,648 | +10 | 37,253,956 | +9 | 40,467,295 | +8 | 43,631,295 |
Los Angeles County | 9,519,338 | +3 | 9,818,605 | +6 | 10,369,367 | +4 | 10,759,850 |
Total Working Age Population:
Total Households:
Total Working Age Population:
Total Households:
Total Working Age Population:
Total Households: