Retail Space
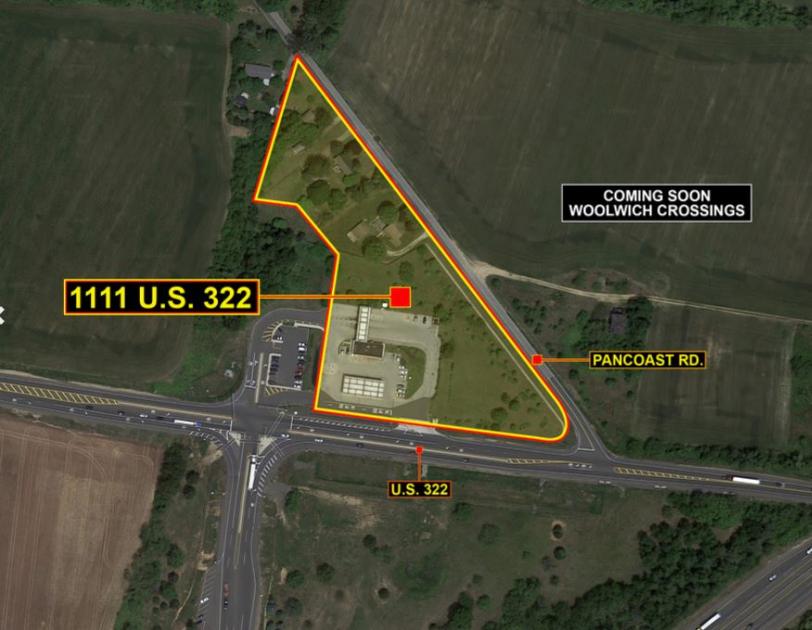
1111 U.S. 322 Woolwich Township, NJ 08085
1111 U.S. 322 Woolwich Township, NJ 08085

Details & Description
Property Highlights
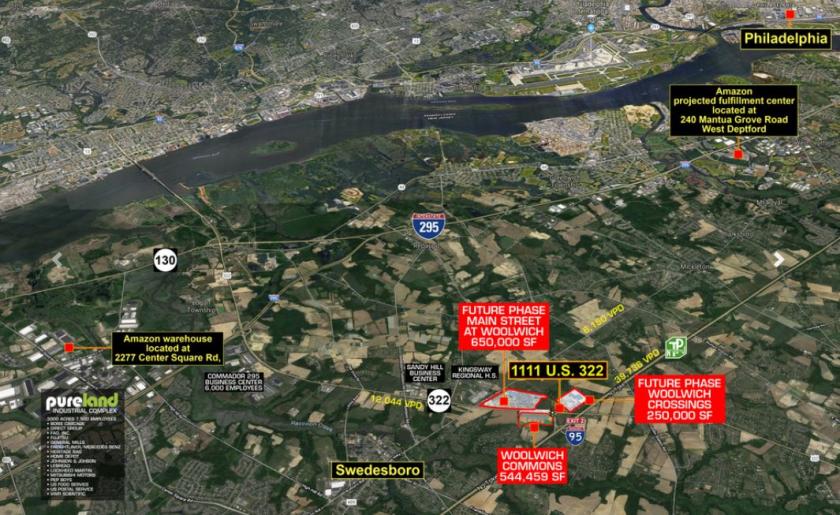
• Enormous amount of residential, industrial, and commercial growth along Route 322.
• Enormous amount of residential, industrial, and commercial growth along Route 322.
Additional Photos

Listing Agents

Giorgio Vasillis
O: 732-449-2000
M: 732-579-7002
vasilis@sitarcompany.com
O: 732-449-2000
M: 732-579-7002
vasilis@sitarcompany.com
While we strive to provide the most accurate information, all listing information, and demographic data, is provided by third-parties. As such, MyEListing will not be responsible for the accuracy of the information. It is strongly recommended that you verify all information with the listing agent, and any relevant agencies, prior to making any decisions.


